


Search 12,100+ Infographics!

A History of Women in Converse
In 2017, the Converse All Star will turn 100 years old. While it is quite easy to trace the visual history of the All Star in men’s fashion starting in these periods, it is considerably more difficult to do so for women’s fashion. Here is an infographic related to the Converse All Star as it has appeared on women’s feet in popular culture.
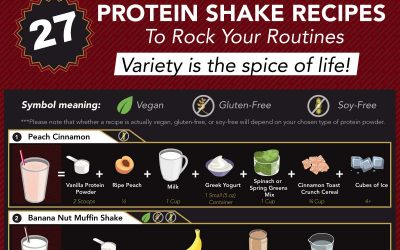
27 Protein Shake Recipes to Rock Your Routines
Protein shakes are great – the only problem with them is that they get a bit boring when you stick to the same old recipe week after week. That’s why it’s fun to mix it up every now and then and try some new flavors! This infographic has 27 different recipes for you to experiment with.
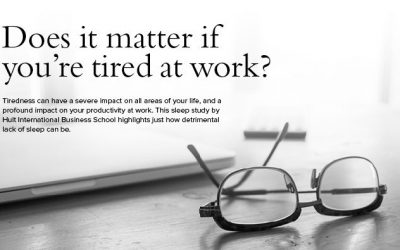
Effects of Sleep-Deprivation at Work
Sleep is very important. It’s vital for your physical, emotional and mental well-being. It has also a great impact on your performance at work. Sleep-deprivation can seriously affect concentration, self-awareness, multi-tasking and decision-making. This infographic summarizes the most important conclusion from research about sleep-deprivation.
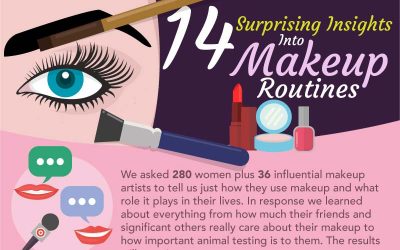
14 Surprising Insights Into Makeup Routines
Women prefer to do their own makeup, rather than hire a professional makeup artist or beautician, and almost eight out of ten women wear makeup to a social event. Want to know how your makeup routine compares to other women? Check out this infographic to unveil some surprising facts and hear what influential makeup artists have to say.
Creating Structure For Teens With Behavioral Disorders
Structure helps people understand the reason they move in a certain direction, and what is acceptable behaviors in the world. Creating structure for children and teens with behavioral disorders can be a challenge but is extremely crucial for their development. This infographic does a great job at depicting ways to create structure for teens with behavioral disorders.

How the asTech Device Helps Minimize False and Secondary Claims
Scanning vehicles that arrive in a collision repair shop with a asTech device is a simple way to reduce the instances of secondary and false insurance claims. By identifying all of the existing issues in the vehicle, the asTech makes extraneous repairs a thing of the past.

Work Boots Safety Standards
If you are planning to buy work boots or safety boots, you need to know about the ASTM label comes with the boots. It includes symbols, numbers, and letters on the labels which have specific meanings. Here is a infographic explaining ASTM label of safety boots.

Back To School Spending
The $500 billion in public funding for America’s 98,500 schools is not sufficient to cover necessary classroom supplies, based on data from the US Census Bureau and the Education Market Association (formerly the NSSEA). as such, American teachers and parents still spend 1.6 billion every year on school supplies. This infographic takes a deeper look at back to school spending.

Big Screen Breaks
In this infographic, the team at the Daffodil Hotel picked a few of their favorite “movie hotels” and then created some reviews from the characters who stayed at them. Read on for some illuminating feedback on big screen breaks.
The Ultimate Guide To Daytime Napping
We’ve all been in a position where our eyelids have been impossible to keep open in the middle of the day and the idea of a swift nap has been too difficult to resist. But not knowing how to nap properly can mean that we often wake up feeling less than refreshed. With this guide, the team at Dreams covers the basics of how to achieve the perfect daytime nap.
A History of Women in Converse
In 2017, the Converse All Star will turn 100 years old. While it is quite easy to trace the visual history of the All Star in men’s fashion starting in these periods, it is considerably more difficult to do so for women’s fashion. Here is an infographic related to the Converse All Star as it has appeared on women’s feet in popular culture.
27 Protein Shake Recipes to Rock Your Routines
Protein shakes are great – the only problem with them is that they get a bit boring when you stick to the same old recipe week after week. That’s why it’s fun to mix it up every now and then and try some new flavors! This infographic has 27 different recipes for you to experiment with.
Effects of Sleep-Deprivation at Work
Sleep is very important. It’s vital for your physical, emotional and mental well-being. It has also a great impact on your performance at work. Sleep-deprivation can seriously affect concentration, self-awareness, multi-tasking and decision-making. This infographic summarizes the most important conclusion from research about sleep-deprivation.
14 Surprising Insights Into Makeup Routines
Women prefer to do their own makeup, rather than hire a professional makeup artist or beautician, and almost eight out of ten women wear makeup to a social event. Want to know how your makeup routine compares to other women? Check out this infographic to unveil some surprising facts and hear what influential makeup artists have to say.
Creating Structure For Teens With Behavioral Disorders
Structure helps people understand the reason they move in a certain direction, and what is acceptable behaviors in the world. Creating structure for children and teens with behavioral disorders can be a challenge but is extremely crucial for their development. This infographic does a great job at depicting ways to create structure for teens with behavioral disorders.
How the asTech Device Helps Minimize False and Secondary Claims
Scanning vehicles that arrive in a collision repair shop with a asTech device is a simple way to reduce the instances of secondary and false insurance claims. By identifying all of the existing issues in the vehicle, the asTech makes extraneous repairs a thing of the past.
Work Boots Safety Standards
If you are planning to buy work boots or safety boots, you need to know about the ASTM label comes with the boots. It includes symbols, numbers, and letters on the labels which have specific meanings. Here is a infographic explaining ASTM label of safety boots.
Back To School Spending
The $500 billion in public funding for America’s 98,500 schools is not sufficient to cover necessary classroom supplies, based on data from the US Census Bureau and the Education Market Association (formerly the NSSEA). as such, American teachers and parents still spend 1.6 billion every year on school supplies. This infographic takes a deeper look at back to school spending.
Big Screen Breaks
In this infographic, the team at the Daffodil Hotel picked a few of their favorite “movie hotels” and then created some reviews from the characters who stayed at them. Read on for some illuminating feedback on big screen breaks.
The Ultimate Guide To Daytime Napping
We’ve all been in a position where our eyelids have been impossible to keep open in the middle of the day and the idea of a swift nap has been too difficult to resist. But not knowing how to nap properly can mean that we often wake up feeling less than refreshed. With this guide, the team at Dreams covers the basics of how to achieve the perfect daytime nap.
Partners


Browse Archives By Category
Animated Infographics
Business Infographics
Career & Jobs Infographics
Education Infographics
Entertainment Industry Infographics
Environmental Infographics
Finance & Money Infographics
Food & Drink Infographics
Health Infographics
Historical Infographics
Home & Garden Infographics
Internet Infographics
Law and Legal Infographics
Lifestyle Infographics
Marketing Infographics
Offbeat Infographics
Parenting Infographics
Pets & Animals Infographics
Political Infographics
Shopping Infographics
Sports and Athletic Infographics
Technology Infographics
Transportation Infographics
Travel Infographics
Video Infographics