


Search 12,100+ Infographics!

The Shopper & In-Store Marketing World
This infographic from Cubemc is about the shopper and in-store marketing world and contains info regarding “what is shopper marketing” as well as “what are the tools and trends in shopper marketing.”

Vaping is Better than Smoking
Vaping is better than smoking both for your wallet and your lungs. Vaping is 95% less harmful than smoking. Vaping is also 40% cheaper than smoking. Can vaping help you quit smoking? Find out the answers in the following infographic.

Demystifying Cyber Security
The following infographic from DHR International outlines four simple things you can do to improve your information security, three key steps to take after a data breach, and a few examples of major companies that suffered at the hands of Internet attackers.

Traveling In Europe With Your Dog
This infographic from Craig Manor takes you step by step through the whole process of entering Europe with your dog. It cover things such as what the legal requirements are, booking a flight, choosing an airline, what to check when picking a destination and how to make sure your dog is ready to fly.

Fictional TV and Movie Couches
Here is a collection by HomeAdvisor of some of the favorite places characters from popular TV shows and movies loved to sit. Each couch, chair or bench played a specific role in the shows and are remembered by many avid fans.

What Makes A McLaren?
Discover the incredible journey of the McLaren brand – from the brain child of Bruce McLaren down to the legendary P1 and innovative carbon fibre chassis. This infographic tracks the amazing performance and achievement of what makes this specialist car.

Narcotics (Opioids) – Navigating the Painkiller Epidemic
How safe is your medicine cabinet? 60% – 70% of teens say that the home medicine cabinets are one of their easiest sources of drugs. Here is an infographic to serve as your very own cheat sheet to keep you up to date on narcotic abuse, and demonstrates why you should educate your teen on the dangers of prescription drugs.
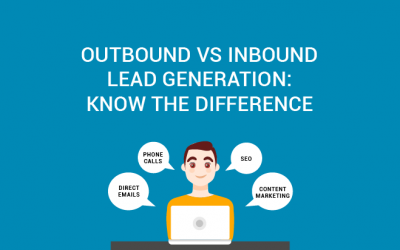
Outbound VS Inbound Lead Generation: Know the Difference
At the beginning of every lead generation initiative, it’s important to understand the difference between inbound and outbound lead generation. The concepts behind each approach use different execution methods so it’s vital to comprehend the logic behind them before you start out. Here’s a quick guide to inbound and outbound lead generation.

Billion Dollar Companies that Started in Garage
Every new company has to start somewhere. And who told you that to launch a new business you need a corporate office? Amazon, Apple, HP, Disney, Google all started in garages and became billion dollar corporations. In this infographic, check out the most gigantic businesses in the world that launched in someone’s garage.
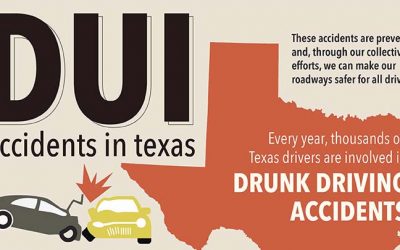
DUI Accidents in Texas
Drinking and driving in Texas is a growing problem and it’s time to take a stand. With 29% of all fatal Texas vehicle accidents caused by DUIs, Texans can’t afford to look the other way. Learn the most likely times DUIs take place in the state, the cities where DUIs occur most and how to prevent drunk driving in the future.
The Shopper & In-Store Marketing World
This infographic from Cubemc is about the shopper and in-store marketing world and contains info regarding “what is shopper marketing” as well as “what are the tools and trends in shopper marketing.”
Vaping is Better than Smoking
Vaping is better than smoking both for your wallet and your lungs. Vaping is 95% less harmful than smoking. Vaping is also 40% cheaper than smoking. Can vaping help you quit smoking? Find out the answers in the following infographic.
Demystifying Cyber Security
The following infographic from DHR International outlines four simple things you can do to improve your information security, three key steps to take after a data breach, and a few examples of major companies that suffered at the hands of Internet attackers.
Traveling In Europe With Your Dog
This infographic from Craig Manor takes you step by step through the whole process of entering Europe with your dog. It cover things such as what the legal requirements are, booking a flight, choosing an airline, what to check when picking a destination and how to make sure your dog is ready to fly.
Fictional TV and Movie Couches
Here is a collection by HomeAdvisor of some of the favorite places characters from popular TV shows and movies loved to sit. Each couch, chair or bench played a specific role in the shows and are remembered by many avid fans.
What Makes A McLaren?
Discover the incredible journey of the McLaren brand – from the brain child of Bruce McLaren down to the legendary P1 and innovative carbon fibre chassis. This infographic tracks the amazing performance and achievement of what makes this specialist car.
Narcotics (Opioids) – Navigating the Painkiller Epidemic
How safe is your medicine cabinet? 60% – 70% of teens say that the home medicine cabinets are one of their easiest sources of drugs. Here is an infographic to serve as your very own cheat sheet to keep you up to date on narcotic abuse, and demonstrates why you should educate your teen on the dangers of prescription drugs.
Outbound VS Inbound Lead Generation: Know the Difference
At the beginning of every lead generation initiative, it’s important to understand the difference between inbound and outbound lead generation. The concepts behind each approach use different execution methods so it’s vital to comprehend the logic behind them before you start out. Here’s a quick guide to inbound and outbound lead generation.
Billion Dollar Companies that Started in Garage
Every new company has to start somewhere. And who told you that to launch a new business you need a corporate office? Amazon, Apple, HP, Disney, Google all started in garages and became billion dollar corporations. In this infographic, check out the most gigantic businesses in the world that launched in someone’s garage.
DUI Accidents in Texas
Drinking and driving in Texas is a growing problem and it’s time to take a stand. With 29% of all fatal Texas vehicle accidents caused by DUIs, Texans can’t afford to look the other way. Learn the most likely times DUIs take place in the state, the cities where DUIs occur most and how to prevent drunk driving in the future.
Partners


Browse Archives By Category
Animated Infographics
Business Infographics
Career & Jobs Infographics
Education Infographics
Entertainment Industry Infographics
Environmental Infographics
Finance & Money Infographics
Food & Drink Infographics
Health Infographics
Historical Infographics
Home & Garden Infographics
Internet Infographics
Law and Legal Infographics
Lifestyle Infographics
Marketing Infographics
Offbeat Infographics
Parenting Infographics
Pets & Animals Infographics
Political Infographics
Shopping Infographics
Sports and Athletic Infographics
Technology Infographics
Transportation Infographics
Travel Infographics
Video Infographics