


Search 12,100+ Infographics!
Which States Are the Best (or the Worst) at Recycling?
Each U.S. state has its own set of rules and regulations when it comes to recycling, with some states taking the task of reducing their carbon footprint far more seriously than others. The BottleStore team set out to find which U.S. states are at the top of their game and which ones need some serious improvement when it comes to recycling and reducing waste.

The Best-Selling Board Games of All Time, Ranked
Board games have been a favorite pastime for thousands of years, with some of today’s most popular board games having been introduced all the way back in 3,000 B.C.E.! Even with video games, streaming services, and other forms of electronic entertainment, many people still turn to board games for a budget-friendly way to spend time with family and friends.
Vinyl Window Replacement Cost
If you plan on doing home improvements, make sure that you do them right. Not everything is a simple DIY job. Case in point: window replacement. This is best to keep to the professionals. Learn more about vinyl window replacement cost in the following infographic.

How a Gift Inspired a Creative Revolution
You never know what the kindness and generosity that a gift can take the direction of the world. Take the case of a simple gift of an Accutron wristwatch that sparked a creative revolution that lead to iconic buildings and sneakers. Learn more in the following infographic.
Which States Get the Most Sleep?
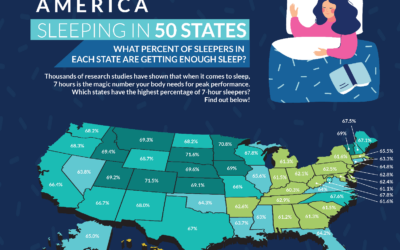
Have you ever wondered if the place you live could impact how much sleep you would get? In other words, do sleepers in some states get more sleep than others? The answer is a resounding yes. The researchers at NapLab looked at the hard data to chart these trends across the map. See where your state falls on the map below.

Corporate Gifting That Matches Your Brand Archetype
Customers take note of how you treat them. This comes through in every interaction that you do, so why do people turn off their brains when it comes to cheap swag and corporate gifts? Learn how to give the right impression with thoughtful corporate gifting that matches your brand archetype in the following infographic.
Who Owns the Most Land in the United States?
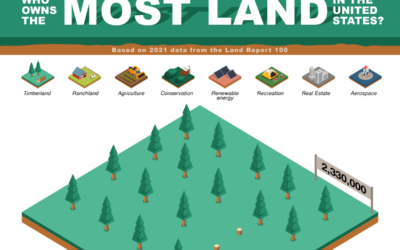
The United States consists of more than 3.7 million square miles of land. From Utqiagvik in Alaska all the way down to Key West in Florida, land in the U.S. takes many different forms. The Madison Trust team looked at data from The Land Report 100 to determine who owns the most land in the U.S. and compiled the results into the following infographic.

How Focus Drinks Can Save You From Distraction
Focus drinks, not overdoing it with coffee and other sugary, caffeine mixes is the answer to your peak performance of an alert state at work. In the following infographic of BioLift looks at a new category of beverages on the market that will change the way you work.

How to Understand a Condo Floor Plan: A Visual Guide
Looking for a new place to buy is thrilling, especially in a new neighborhood. The excitement fuels up as you imagine the life you’ll build in your new home, not to mention the decorations and interior design projects you plan to have, even if what you’re looking at for now are mere floor plans. You can use the following visual guide courtesy of Federal Land to help you understand floor plans better.

How To Negotiate a Job Offer
Many career professionals know they should negotiate a job offer. But most people hold back for a few reasons. They might not know that salary negotiation is a possibility and if they are unsure how to successfully negotiate compensation. Based on The Salary Negotiator’s experience working with hundreds of clients on their salary negotiations, they have identified five key steps that will help anyone successfully navigate a salary negotiation.
Which States Are the Best (or the Worst) at Recycling?
Each U.S. state has its own set of rules and regulations when it comes to recycling, with some states taking the task of reducing their carbon footprint far more seriously than others. The BottleStore team set out to find which U.S. states are at the top of their game and which ones need some serious improvement when it comes to recycling and reducing waste.
The Best-Selling Board Games of All Time, Ranked
Board games have been a favorite pastime for thousands of years, with some of today’s most popular board games having been introduced all the way back in 3,000 B.C.E.! Even with video games, streaming services, and other forms of electronic entertainment, many people still turn to board games for a budget-friendly way to spend time with family and friends.
Vinyl Window Replacement Cost
If you plan on doing home improvements, make sure that you do them right. Not everything is a simple DIY job. Case in point: window replacement. This is best to keep to the professionals. Learn more about vinyl window replacement cost in the following infographic.
How a Gift Inspired a Creative Revolution
You never know what the kindness and generosity that a gift can take the direction of the world. Take the case of a simple gift of an Accutron wristwatch that sparked a creative revolution that lead to iconic buildings and sneakers. Learn more in the following infographic.
Which States Get the Most Sleep?
Have you ever wondered if the place you live could impact how much sleep you would get? In other words, do sleepers in some states get more sleep than others? The answer is a resounding yes. The researchers at NapLab looked at the hard data to chart these trends across the map. See where your state falls on the map below.
Corporate Gifting That Matches Your Brand Archetype
Customers take note of how you treat them. This comes through in every interaction that you do, so why do people turn off their brains when it comes to cheap swag and corporate gifts? Learn how to give the right impression with thoughtful corporate gifting that matches your brand archetype in the following infographic.
Who Owns the Most Land in the United States?
The United States consists of more than 3.7 million square miles of land. From Utqiagvik in Alaska all the way down to Key West in Florida, land in the U.S. takes many different forms. The Madison Trust team looked at data from The Land Report 100 to determine who owns the most land in the U.S. and compiled the results into the following infographic.
How Focus Drinks Can Save You From Distraction
Focus drinks, not overdoing it with coffee and other sugary, caffeine mixes is the answer to your peak performance of an alert state at work. In the following infographic of BioLift looks at a new category of beverages on the market that will change the way you work.
How to Understand a Condo Floor Plan: A Visual Guide
Looking for a new place to buy is thrilling, especially in a new neighborhood. The excitement fuels up as you imagine the life you’ll build in your new home, not to mention the decorations and interior design projects you plan to have, even if what you’re looking at for now are mere floor plans. You can use the following visual guide courtesy of Federal Land to help you understand floor plans better.
How To Negotiate a Job Offer
Many career professionals know they should negotiate a job offer. But most people hold back for a few reasons. They might not know that salary negotiation is a possibility and if they are unsure how to successfully negotiate compensation. Based on The Salary Negotiator’s experience working with hundreds of clients on their salary negotiations, they have identified five key steps that will help anyone successfully navigate a salary negotiation.
Partners


Browse Archives By Category
Animated Infographics
Business Infographics
Career & Jobs Infographics
Education Infographics
Entertainment Industry Infographics
Environmental Infographics
Finance & Money Infographics
Food & Drink Infographics
Health Infographics
Historical Infographics
Home & Garden Infographics
Internet Infographics
Law and Legal Infographics
Lifestyle Infographics
Marketing Infographics
Offbeat Infographics
Parenting Infographics
Pets & Animals Infographics
Political Infographics
Shopping Infographics
Sports and Athletic Infographics
Technology Infographics
Transportation Infographics
Travel Infographics
Video Infographics