


Search 12,100+ Infographics!
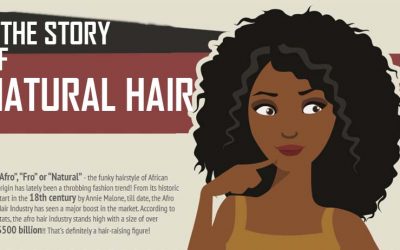
The Story Of Natural Hair
Over the years, The “Natural Black Hair ” been associated with the ideology of white visual conception. Millions of African Americans have used their West roots and their artistry to create styles and standards that reflect the unique black culture. Learn all about it in this infographic.

The Changing Face of UK Energy
This infographic provides an easy snapshot of the current energy situation in the UK. Through this we can see how our energy production has evolved over time. Coal, for example, once provided the vast majority of the United Kingdom’s power. Yet in 2015 coal was overtaken by renewable energy for the first time, when renewable energy provided one quarter of the UK’s electricity.

20 Incredible Movie Role Recasts
Your favorite movies could have been very different if the iconic characters were played by different actors and actresses. MyOffers has created an infographic to show you how different these movies could have been, but would you be able to imagine John Travolta saying ‘’Life is like a box of chocolates’’?

Normal Defiant Behavior or Oppositional Defiant Disorder?
How is a parent to know what is normal age appropriate defiant behavior or if their child is displaying signs of Oppositional Defiant Disorder? This infographic is meant to bring awareness to ODD and help parents understand what to look for in their child’s behavior that can be signs of the disorder.

How Does Color Influence Customer Behavior?
The ways consumers react to colors and the emotions associated with them can impact how they respond to a product. This infographic offers insight into how colors influence customer perception.

How Dogs Improve Your Health
They say that a dog is man’s best friend, but dogs are more than just our best friends, Sure, these loyal critters stand next to us to keep us company, help us feel protected and make sure we always feel loved. But, did you know that their affectionate kisses may be actually improving our health one lick at a time?
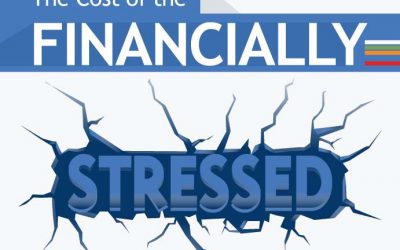
The Cost of the Financially Stressed
When employees find themselves in financial stress, it puts their health, job performance, morale, and even their ethics and integrity at risk. This infographic looks at the cost of being financially stressed.
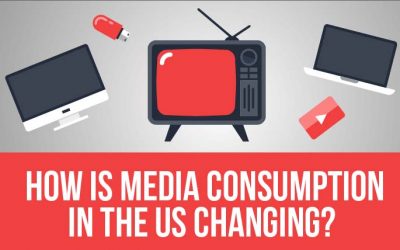
How is Media Consumption in the US Changing?
Who is watching on-demand, streaming video? How do millennials consume media differently than other generations? How much time do we really spend on social media? Where do we consume media? BroadbandSearch sought to answer these questions for this infographic detailing media consumption in the United States.

Technology and The Future of America’s Infrastructure
Across the US, highways are in poor shape and deteriorating by the day. Community leaders realize the important of making improvements and updating bridges, roads and highways but at an aggregate cost estimated in the billions, most are unsure of this crucial investment will be financed. Fueling the issue is the fact that highway congestion in major metro areas is becoming a problem as populations grow and morning commutes increase.
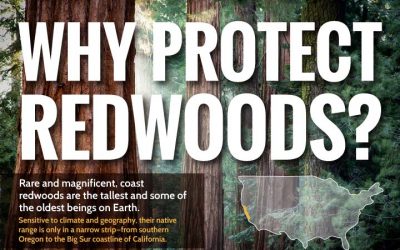
Why Protect Redwoods
Save the Redwoods League has released the following infographic letting people know why they should protect redwoods. Redwoods are some of the tallest and oldest living beings on Earth and they provide critical life support for people and wildlife.
The Story Of Natural Hair
Over the years, The “Natural Black Hair ” been associated with the ideology of white visual conception. Millions of African Americans have used their West roots and their artistry to create styles and standards that reflect the unique black culture. Learn all about it in this infographic.
The Changing Face of UK Energy
This infographic provides an easy snapshot of the current energy situation in the UK. Through this we can see how our energy production has evolved over time. Coal, for example, once provided the vast majority of the United Kingdom’s power. Yet in 2015 coal was overtaken by renewable energy for the first time, when renewable energy provided one quarter of the UK’s electricity.
20 Incredible Movie Role Recasts
Your favorite movies could have been very different if the iconic characters were played by different actors and actresses. MyOffers has created an infographic to show you how different these movies could have been, but would you be able to imagine John Travolta saying ‘’Life is like a box of chocolates’’?
Normal Defiant Behavior or Oppositional Defiant Disorder?
How is a parent to know what is normal age appropriate defiant behavior or if their child is displaying signs of Oppositional Defiant Disorder? This infographic is meant to bring awareness to ODD and help parents understand what to look for in their child’s behavior that can be signs of the disorder.
How Does Color Influence Customer Behavior?
The ways consumers react to colors and the emotions associated with them can impact how they respond to a product. This infographic offers insight into how colors influence customer perception.
How Dogs Improve Your Health
They say that a dog is man’s best friend, but dogs are more than just our best friends, Sure, these loyal critters stand next to us to keep us company, help us feel protected and make sure we always feel loved. But, did you know that their affectionate kisses may be actually improving our health one lick at a time?
The Cost of the Financially Stressed
When employees find themselves in financial stress, it puts their health, job performance, morale, and even their ethics and integrity at risk. This infographic looks at the cost of being financially stressed.
How is Media Consumption in the US Changing?
Who is watching on-demand, streaming video? How do millennials consume media differently than other generations? How much time do we really spend on social media? Where do we consume media? BroadbandSearch sought to answer these questions for this infographic detailing media consumption in the United States.
Technology and The Future of America’s Infrastructure
Across the US, highways are in poor shape and deteriorating by the day. Community leaders realize the important of making improvements and updating bridges, roads and highways but at an aggregate cost estimated in the billions, most are unsure of this crucial investment will be financed. Fueling the issue is the fact that highway congestion in major metro areas is becoming a problem as populations grow and morning commutes increase.
Why Protect Redwoods
Save the Redwoods League has released the following infographic letting people know why they should protect redwoods. Redwoods are some of the tallest and oldest living beings on Earth and they provide critical life support for people and wildlife.
Partners


Browse Archives By Category
Animated Infographics
Business Infographics
Career & Jobs Infographics
Education Infographics
Entertainment Industry Infographics
Environmental Infographics
Finance & Money Infographics
Food & Drink Infographics
Health Infographics
Historical Infographics
Home & Garden Infographics
Internet Infographics
Law and Legal Infographics
Lifestyle Infographics
Marketing Infographics
Offbeat Infographics
Parenting Infographics
Pets & Animals Infographics
Political Infographics
Shopping Infographics
Sports and Athletic Infographics
Technology Infographics
Transportation Infographics
Travel Infographics
Video Infographics