


Search 12,100+ Infographics!

Play It Safe When It Comes to Online Payments
It’s the age of the smartphone and chances are you’re probably using your device to buy merchandise, make airline reservations or pay a bill. While convenient, using a mobile phone can make you susceptible to identity theft. Check out the following infographic for five easy tips on how you can help protect yourself online.

How Common is Cancer Misdiagnosis?
A major 2014 study found that 12 million US patients are misdiagnosed every year. That’s a huge, scary number, and the research got tons of press. Even non-medical news sources, like CBS, picked up on the story, crafting shocking headlines. But unfortunately, at least for patients, the study only looked into diagnostic errors affecting outpatients.

8 Ways To Lower Your Utility Bill This Summer
Are you among the countless people who, month after month, find themselves in this “catch twenty-two” dilemma—“should I shut off the A/C and save money, or should I stay cool and pay that high utility bill?” Well, thanks to this infographic from Arctic Air Services, you won’t need to choose between cost and comfort anymore.

The Different Data Science Roles
Here is an infographic that breaks down the skill-sets and tools needed to make it in the data science industry as well as the salaries you can expect from various employers that will hire you.

Healthy Food Swaps
Small changes can have big results and make healthy eating a more manageable process. Instantly cut calories with the simple food swaps displayed in this infographic from HealthyLife.

Most Common Truck Accidents and How to Avoid Them
In this infographic, Bryant Surety Bonds takes a look at the top reasons for truck accidents in the U.S. and most importantly – how to avoid them. Driver fatigue, bad weather or roadway problems include some of the most common reasons. How can truck drivers and federal regulations increase road safety? Read on to find out.

Responsive Design and the Impact of Smartphones
A lot of things have changed with the increase of smartphone users, especially for website owners, email marketeers and designers. Whereas before it was okay to design with one size in mind, nowadays you will need to ensure compatibility for the complete range of mobile devices, tablets, and e-readers.

Time & Money Saving Tips From Our Mortgage Experts
This infographic includes some insights from the mortgage loan officers at Community First that can help you save time and money when you are ready to purchase a home.
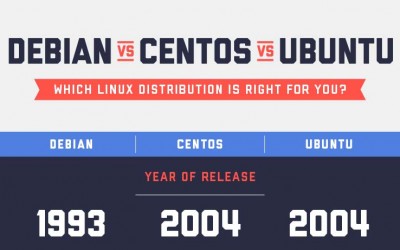
Which Linux Distribution Is Right For You?
When setting up a new web server for your website, one of the most important decisions you have to consider making is which operating system you are going to use. If you’ve moved past the Windows Server versus Linux Server debate and decided to go host your website on a Linux Server, you have a whole host of distributions to chose from.

History Of Web Design & People Who Made It Happen
Have you ever wondered what was the very first website to debut online or who was the intelligent person to build something called a website and how did it look then? Web design trends have come a long way since 1990. This infographic takes a the history of web design and the people who made it happen.
Play It Safe When It Comes to Online Payments
It’s the age of the smartphone and chances are you’re probably using your device to buy merchandise, make airline reservations or pay a bill. While convenient, using a mobile phone can make you susceptible to identity theft. Check out the following infographic for five easy tips on how you can help protect yourself online.
How Common is Cancer Misdiagnosis?
A major 2014 study found that 12 million US patients are misdiagnosed every year. That’s a huge, scary number, and the research got tons of press. Even non-medical news sources, like CBS, picked up on the story, crafting shocking headlines. But unfortunately, at least for patients, the study only looked into diagnostic errors affecting outpatients.
8 Ways To Lower Your Utility Bill This Summer
Are you among the countless people who, month after month, find themselves in this “catch twenty-two” dilemma—“should I shut off the A/C and save money, or should I stay cool and pay that high utility bill?” Well, thanks to this infographic from Arctic Air Services, you won’t need to choose between cost and comfort anymore.
The Different Data Science Roles
Here is an infographic that breaks down the skill-sets and tools needed to make it in the data science industry as well as the salaries you can expect from various employers that will hire you.
Healthy Food Swaps
Small changes can have big results and make healthy eating a more manageable process. Instantly cut calories with the simple food swaps displayed in this infographic from HealthyLife.
Most Common Truck Accidents and How to Avoid Them
In this infographic, Bryant Surety Bonds takes a look at the top reasons for truck accidents in the U.S. and most importantly – how to avoid them. Driver fatigue, bad weather or roadway problems include some of the most common reasons. How can truck drivers and federal regulations increase road safety? Read on to find out.
Responsive Design and the Impact of Smartphones
A lot of things have changed with the increase of smartphone users, especially for website owners, email marketeers and designers. Whereas before it was okay to design with one size in mind, nowadays you will need to ensure compatibility for the complete range of mobile devices, tablets, and e-readers.
Time & Money Saving Tips From Our Mortgage Experts
This infographic includes some insights from the mortgage loan officers at Community First that can help you save time and money when you are ready to purchase a home.
Which Linux Distribution Is Right For You?
When setting up a new web server for your website, one of the most important decisions you have to consider making is which operating system you are going to use. If you’ve moved past the Windows Server versus Linux Server debate and decided to go host your website on a Linux Server, you have a whole host of distributions to chose from.
History Of Web Design & People Who Made It Happen
Have you ever wondered what was the very first website to debut online or who was the intelligent person to build something called a website and how did it look then? Web design trends have come a long way since 1990. This infographic takes a the history of web design and the people who made it happen.
Partners


Browse Archives By Category
Animated Infographics
Business Infographics
Career & Jobs Infographics
Education Infographics
Entertainment Industry Infographics
Environmental Infographics
Finance & Money Infographics
Food & Drink Infographics
Health Infographics
Historical Infographics
Home & Garden Infographics
Internet Infographics
Law and Legal Infographics
Lifestyle Infographics
Marketing Infographics
Offbeat Infographics
Parenting Infographics
Pets & Animals Infographics
Political Infographics
Shopping Infographics
Sports and Athletic Infographics
Technology Infographics
Transportation Infographics
Travel Infographics
Video Infographics