


Search 12,100+ Infographics!

High Tech Kitchen Apps & Hacks
Have you been yearning to up your kitchen game but without bulky gadgets or “unitasker” appliances? Don’t worry. These days, there are many ways to optimize cozy kitchens with cool high-tech gadgets that save space instead of taking it up. ForRent.com takes a look at high tech kitchen apps and hacks in this infographic.
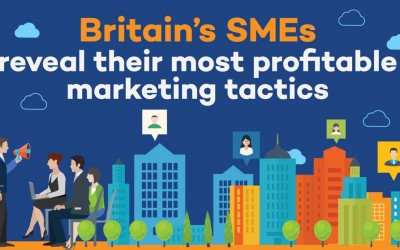
Most Profitable Marketing Tactics for British SMEs
The world of marketing is constantly changing, and staying on top of the latest marketing tactics is a key way for businesses to stay ahead of the competition. Because of this, Display Wizard surveyed over 10,000 SME owners to find out their best marketing tactics, with some surprising results revealed.
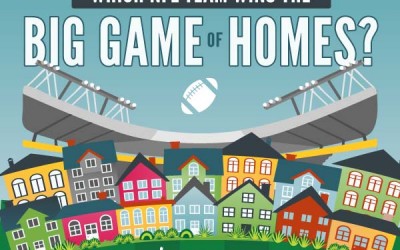
NFL Stadiums and the Cost of Homes
It’s every fan’s dream: a home right on the doorstep of their favorite football team. But which cities are the most favorable for hardcore fans? Sure, there’s the price of the home itself, but there’s so much more to it: the stadium, the cost of tickets and how much home your money will buy you. Here Homes.com takes a look at what it takes to call the red zone your home.
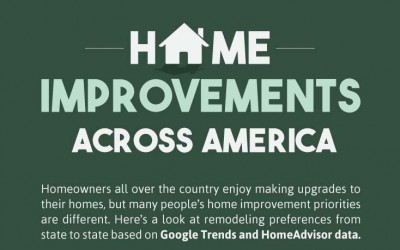
Home Improvements Across America
The joys of home ownership often come hand in hand with the struggles of home ownership. As good as any living space is, the time will come when improvements are needed. Sometimes they’re small but other times they can be quite large.
Men’s Guide to Perfect Pant Shirt Combination
Landing that big job of your dream is not the end of the struggle. It is just the beginning. Now that you have got the part, you have a lot of people to impress. Dressing up for the job assures the authority that you are a professional and appreciate the opportunity that you have been provided with. However, this can be an issue if you have never taken dressing up seriously before.

The World’s Smartest Cities
This infographic takes a look at “smart cities” designed using technologies and innovations that deal with proper waste disposal, use of renewable energy sources, an effective keeping of peace and security and, water conservation.
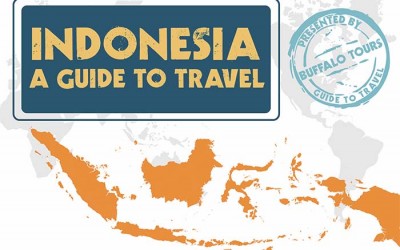
A Guide to Travel in Indonesia
If you’re planning a trip to Indonesia, or if you’re just in the beginning stages of thinking about travel to Indonesia, this infographic is meant to save you some time. It includes some basic information such as where to go, what to do, and what sort of do’s and don’ts you should know before traveling there.
How to Wear a Waist Trainer
This infographic goes into the do’s and don’ts of wearing a waist trainer to lose weight and get a slim figure. Aside from attending the svelte and sexy appearance you so desire, the process of training your waist can also promote a few notable health benefits.

Trendy Hairstyles For Men in 2016
First impressions are important, and they start with your hairstyle. For men, it can be challenging to find the best hairstyle based on current fashion trends. Here is a guide developed by MensHairstylesToday.com to help you choose from the trendiest hairstyles of 2016.

Sobering Game Day Stats: The Downside of Super Bowl Sunday
With all the excitement surrounding the Super Bowl, safety might be the last thing you want to think to about. As you roll out the fan gear, wings and beer for this year’s Super Bowl, cheer for your favorite team with these important drunk driving safety stats and tips in mind.
High Tech Kitchen Apps & Hacks
Have you been yearning to up your kitchen game but without bulky gadgets or “unitasker” appliances? Don’t worry. These days, there are many ways to optimize cozy kitchens with cool high-tech gadgets that save space instead of taking it up. ForRent.com takes a look at high tech kitchen apps and hacks in this infographic.
Most Profitable Marketing Tactics for British SMEs
The world of marketing is constantly changing, and staying on top of the latest marketing tactics is a key way for businesses to stay ahead of the competition. Because of this, Display Wizard surveyed over 10,000 SME owners to find out their best marketing tactics, with some surprising results revealed.
NFL Stadiums and the Cost of Homes
It’s every fan’s dream: a home right on the doorstep of their favorite football team. But which cities are the most favorable for hardcore fans? Sure, there’s the price of the home itself, but there’s so much more to it: the stadium, the cost of tickets and how much home your money will buy you. Here Homes.com takes a look at what it takes to call the red zone your home.
Home Improvements Across America
The joys of home ownership often come hand in hand with the struggles of home ownership. As good as any living space is, the time will come when improvements are needed. Sometimes they’re small but other times they can be quite large.
Men’s Guide to Perfect Pant Shirt Combination
Landing that big job of your dream is not the end of the struggle. It is just the beginning. Now that you have got the part, you have a lot of people to impress. Dressing up for the job assures the authority that you are a professional and appreciate the opportunity that you have been provided with. However, this can be an issue if you have never taken dressing up seriously before.
The World’s Smartest Cities
This infographic takes a look at “smart cities” designed using technologies and innovations that deal with proper waste disposal, use of renewable energy sources, an effective keeping of peace and security and, water conservation.
A Guide to Travel in Indonesia
If you’re planning a trip to Indonesia, or if you’re just in the beginning stages of thinking about travel to Indonesia, this infographic is meant to save you some time. It includes some basic information such as where to go, what to do, and what sort of do’s and don’ts you should know before traveling there.
How to Wear a Waist Trainer
This infographic goes into the do’s and don’ts of wearing a waist trainer to lose weight and get a slim figure. Aside from attending the svelte and sexy appearance you so desire, the process of training your waist can also promote a few notable health benefits.
Trendy Hairstyles For Men in 2016
First impressions are important, and they start with your hairstyle. For men, it can be challenging to find the best hairstyle based on current fashion trends. Here is a guide developed by MensHairstylesToday.com to help you choose from the trendiest hairstyles of 2016.
Sobering Game Day Stats: The Downside of Super Bowl Sunday
With all the excitement surrounding the Super Bowl, safety might be the last thing you want to think to about. As you roll out the fan gear, wings and beer for this year’s Super Bowl, cheer for your favorite team with these important drunk driving safety stats and tips in mind.
Partners


Browse Archives By Category
Animated Infographics
Business Infographics
Career & Jobs Infographics
Education Infographics
Entertainment Industry Infographics
Environmental Infographics
Finance & Money Infographics
Food & Drink Infographics
Health Infographics
Historical Infographics
Home & Garden Infographics
Internet Infographics
Law and Legal Infographics
Lifestyle Infographics
Marketing Infographics
Offbeat Infographics
Parenting Infographics
Pets & Animals Infographics
Political Infographics
Shopping Infographics
Sports and Athletic Infographics
Technology Infographics
Transportation Infographics
Travel Infographics
Video Infographics