


Search 12,100+ Infographics!
12 Facts of Christmas – Things You Didn’t Know
Christmas – the time of the year that brings to mind chilly weather and toasty fires, gift giving, family gatherings, holiday beverages, and enough food to last well into next year. However, there’s more to Christmas than most know – Xmas origins, Santa’s calorie intake, and true cost of the infamous 12 Days of Christmas for example.
Stop Procrastinating
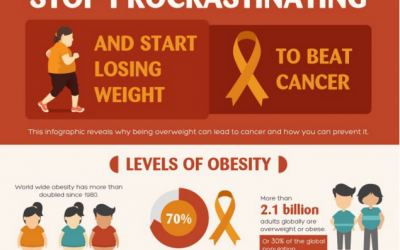
Being afraid of cancer is universal, but unfortunately doing something to prevent it is not. Learn how you can take steps to prevent cancer from this infographic.
How to Become a Creative Genius in 5 Days
There is no doubt that you’ll be busy at Christmas and New Year. But what about the five days in between? Known to some as Twixtmas, those five days are the perfect opportunity to become a creative genius. Zippi will show you how in the following infographic. [Click...

4 Ways Your Construction Job Can Kill You
The lawyers at Banville Law are committed to protecting the rights of construction workers throughout New York State and as such have created this infographic to help you learn more about the most common job site dangers, and how New York’s lawmakers are working to protect you.

9 Ways to Make Sure You Have Effective Meetings
Meetings are essential part of any business. But, in most cases they are the most boring part of the business. Make sure that doesn’t happen to you and discover how to have effective meetings with the help of this interesting infographic.
The Cost of Space Travel
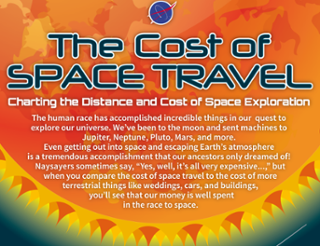
In this infographic, IgniteSpot.com compares the cost of space missions by NASA, ISRO, the ESA, and others to some other high-cost projects. Heard of the Big Dig? Or the Panama Canal? You’d be surprised to learn that these earthly projects cost a whole lot more than traveling to Pluto, Saturn, or Mercury.
Crosby Vs. Ovechkin: The Story of 2 Ice Hockey Legends
Tucker Hockey has created the following infographic comparing Sidney Crosby and Alex Ovechkin. Both have dominated the NHL for over 10 years. This infographic explores which player is better and who may have the greater legacy.
Everyday Dangers Of Slip And Fall Accidents
Slip and fall accidents are incredibly common; studies estimate that around 25,000 people fall every day. And while many of these accidents occur at home, employees and shoppers are at considerable risk in workplaces and retail establishments. Slip, trip, and fall accidents don’t help anyone: victims are injured and accidents put considerable strain on our economy.

Your 90 Day Beauty Calendar
Creating a perfect beauty routine is not easy. Luckily, help is on its way. In this helpful infographic from Holland and Barrett, you will discover everything you need to know to create your own 90 day beauty guide.
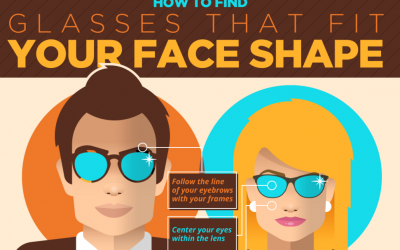
How To Find Glasses That Fit Your Face Shape
Finding glasses to fit your face shape is easy if you know what to look for. Learn more about glasses for your face shape from this infographic by Frames Direct.
12 Facts of Christmas – Things You Didn’t Know
Christmas – the time of the year that brings to mind chilly weather and toasty fires, gift giving, family gatherings, holiday beverages, and enough food to last well into next year. However, there’s more to Christmas than most know – Xmas origins, Santa’s calorie intake, and true cost of the infamous 12 Days of Christmas for example.
Stop Procrastinating
Being afraid of cancer is universal, but unfortunately doing something to prevent it is not. Learn how you can take steps to prevent cancer from this infographic.
How to Become a Creative Genius in 5 Days
There is no doubt that you’ll be busy at Christmas and New Year. But what about the five days in between? Known to some as Twixtmas, those five days are the perfect opportunity to become a creative genius. Zippi will show you how in the following infographic. [Click...
4 Ways Your Construction Job Can Kill You
The lawyers at Banville Law are committed to protecting the rights of construction workers throughout New York State and as such have created this infographic to help you learn more about the most common job site dangers, and how New York’s lawmakers are working to protect you.
9 Ways to Make Sure You Have Effective Meetings
Meetings are essential part of any business. But, in most cases they are the most boring part of the business. Make sure that doesn’t happen to you and discover how to have effective meetings with the help of this interesting infographic.
The Cost of Space Travel
In this infographic, IgniteSpot.com compares the cost of space missions by NASA, ISRO, the ESA, and others to some other high-cost projects. Heard of the Big Dig? Or the Panama Canal? You’d be surprised to learn that these earthly projects cost a whole lot more than traveling to Pluto, Saturn, or Mercury.
Crosby Vs. Ovechkin: The Story of 2 Ice Hockey Legends
Tucker Hockey has created the following infographic comparing Sidney Crosby and Alex Ovechkin. Both have dominated the NHL for over 10 years. This infographic explores which player is better and who may have the greater legacy.
Everyday Dangers Of Slip And Fall Accidents
Slip and fall accidents are incredibly common; studies estimate that around 25,000 people fall every day. And while many of these accidents occur at home, employees and shoppers are at considerable risk in workplaces and retail establishments. Slip, trip, and fall accidents don’t help anyone: victims are injured and accidents put considerable strain on our economy.
Your 90 Day Beauty Calendar
Creating a perfect beauty routine is not easy. Luckily, help is on its way. In this helpful infographic from Holland and Barrett, you will discover everything you need to know to create your own 90 day beauty guide.
How To Find Glasses That Fit Your Face Shape
Finding glasses to fit your face shape is easy if you know what to look for. Learn more about glasses for your face shape from this infographic by Frames Direct.
Partners


Browse Archives By Category
Animated Infographics
Business Infographics
Career & Jobs Infographics
Education Infographics
Entertainment Industry Infographics
Environmental Infographics
Finance & Money Infographics
Food & Drink Infographics
Health Infographics
Historical Infographics
Home & Garden Infographics
Internet Infographics
Law and Legal Infographics
Lifestyle Infographics
Marketing Infographics
Offbeat Infographics
Parenting Infographics
Pets & Animals Infographics
Political Infographics
Shopping Infographics
Sports and Athletic Infographics
Technology Infographics
Transportation Infographics
Travel Infographics
Video Infographics