


Search 12,100+ Infographics!
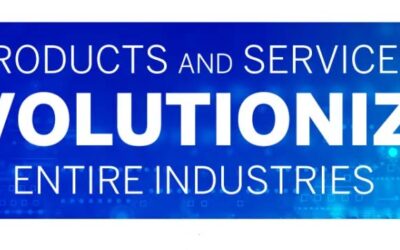
Products and Services That Revolutionized Entire Industries
A world of products has transformed entire industries and shaped our everyday lives, especially with the technological advances of the past few decades. The team at Qualtrics celebrated these technologies with a timeline showing the most influential products and services. From 1981 to 2022, we have seen numerous examples of revolutionary products and technologies.
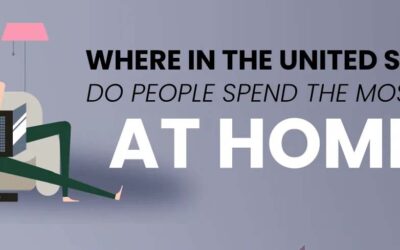
Where in the United States Do People Spend the Most Time at Home?
Rove Lab’s new infographic is a treasure trove of quirky regional facts. They analyzed data to identify where Americans spend the most time at home and presented the results in a map. Their results are based on time-use data and remote-work statistics that rank states. Their work turns everyday routines into something you can geographically observe.
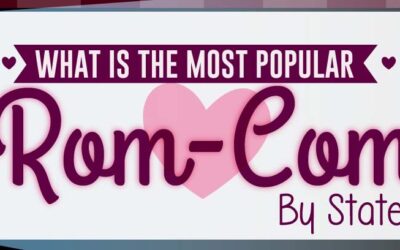
The Most Popular Rom-Coms of All Time
This infographic from PixlParade feels like flipping through a well-loved DVD binder from the 2000s, where each disc carries a memory. The graphic revisits the romantic comedies that shaped movie nights, sleepovers, and the era of love stories filled with witty banter, big feelings, and a perfectly timed soundtrack.

30 Safety Features Every Senior Should Know
An article from Ooma outlines 30 safety tips to help older adults maintain independence and minimize risks at home and online. They begin with cybersecurity essentials, like strong, unique passwords, password managers, secure Wi-Fi, and multi-factor authentication. These can all help defend seniors against a growing world of digital threats.

Benefits of Hibiscus Tea: Nutrition, Health Benefits & How to Brew It Right
Looking for a refreshing drink that’s both delicious and good for your body? Hibiscus tea might be exactly what you need. Made from the dried petals of the hibiscus sabdariffa flower, this vibrant red herbal tea has been enjoyed for centuries across Africa, Asia, and the Caribbean for its bold flavor and powerful wellness benefits.

What Keeping Up With Energy Demand Means to the Power Grid
America’s power demand is surging, but our aging grid can’t keep up. To meet the future, we need smarter, more resilient infrastructure—starting with transformers built here in the United States. Learn more about how what keeping up with energy demand means to the power grid in the following infographic, courtesy of ELSCO.

Understanding Generational and Holiday Shopping Trends
This 2025 Equifax Holiday Spend Trends infographic offers a comprehensive look at the current state of US consumer finances and what retailers and lenders can anticipate in the coming months. Learn more about how to property understand and interpret generational and holiday shopping trends and market research report, courtesy of Equifax.
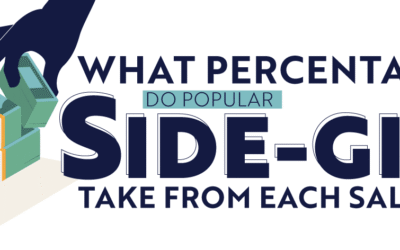
What Percentage Do Popular Side-Gig Apps Take From Each Sale in the U.S.?
A new article from LLC Attorney.com compiles data on fees collected by some of the most widely used freelance and side gig platforms. It shows how much of each transaction is retained by the app rather than the side-gig worker.
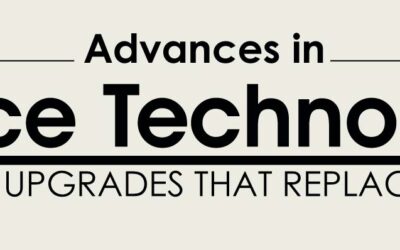
Advances In Office Technology and Upgrades That Replaced Them
The team at Ooma presents a thoughtfully executed and refreshingly clear timeline of office technology advances. It prioritizes readability and structure to show a wide span of technological history without overwhelming the viewer. A linear layout reinforces the idea of technology building on what came before, showing steady progress in a clean presentation that focuses on the facts.
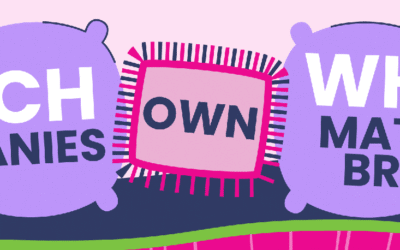
Which Companies Own Which Mattress Brands?
NapLab’s mattress brand ownership infographic is a great example of a chart that makes a complicated topic instantly easy to understand. Their new graphic uses a clean “family tree” layout that clearly labels which mattress labels are owned by which parent companies.
Products and Services That Revolutionized Entire Industries
A world of products has transformed entire industries and shaped our everyday lives, especially with the technological advances of the past few decades. The team at Qualtrics celebrated these technologies with a timeline showing the most influential products and services. From 1981 to 2022, we have seen numerous examples of revolutionary products and technologies.
Where in the United States Do People Spend the Most Time at Home?
Rove Lab’s new infographic is a treasure trove of quirky regional facts. They analyzed data to identify where Americans spend the most time at home and presented the results in a map. Their results are based on time-use data and remote-work statistics that rank states. Their work turns everyday routines into something you can geographically observe.
The Most Popular Rom-Coms of All Time
This infographic from PixlParade feels like flipping through a well-loved DVD binder from the 2000s, where each disc carries a memory. The graphic revisits the romantic comedies that shaped movie nights, sleepovers, and the era of love stories filled with witty banter, big feelings, and a perfectly timed soundtrack.
30 Safety Features Every Senior Should Know
An article from Ooma outlines 30 safety tips to help older adults maintain independence and minimize risks at home and online. They begin with cybersecurity essentials, like strong, unique passwords, password managers, secure Wi-Fi, and multi-factor authentication. These can all help defend seniors against a growing world of digital threats.
Benefits of Hibiscus Tea: Nutrition, Health Benefits & How to Brew It Right
Looking for a refreshing drink that’s both delicious and good for your body? Hibiscus tea might be exactly what you need. Made from the dried petals of the hibiscus sabdariffa flower, this vibrant red herbal tea has been enjoyed for centuries across Africa, Asia, and the Caribbean for its bold flavor and powerful wellness benefits.
What Keeping Up With Energy Demand Means to the Power Grid
America’s power demand is surging, but our aging grid can’t keep up. To meet the future, we need smarter, more resilient infrastructure—starting with transformers built here in the United States. Learn more about how what keeping up with energy demand means to the power grid in the following infographic, courtesy of ELSCO.
Understanding Generational and Holiday Shopping Trends
This 2025 Equifax Holiday Spend Trends infographic offers a comprehensive look at the current state of US consumer finances and what retailers and lenders can anticipate in the coming months. Learn more about how to property understand and interpret generational and holiday shopping trends and market research report, courtesy of Equifax.
What Percentage Do Popular Side-Gig Apps Take From Each Sale in the U.S.?
A new article from LLC Attorney.com compiles data on fees collected by some of the most widely used freelance and side gig platforms. It shows how much of each transaction is retained by the app rather than the side-gig worker.
Advances In Office Technology and Upgrades That Replaced Them
The team at Ooma presents a thoughtfully executed and refreshingly clear timeline of office technology advances. It prioritizes readability and structure to show a wide span of technological history without overwhelming the viewer. A linear layout reinforces the idea of technology building on what came before, showing steady progress in a clean presentation that focuses on the facts.
Which Companies Own Which Mattress Brands?
NapLab’s mattress brand ownership infographic is a great example of a chart that makes a complicated topic instantly easy to understand. Their new graphic uses a clean “family tree” layout that clearly labels which mattress labels are owned by which parent companies.
Partners


Browse Archives By Category
Animated Infographics
Business Infographics
Career & Jobs Infographics
Education Infographics
Entertainment Industry Infographics
Environmental Infographics
Finance & Money Infographics
Food & Drink Infographics
Health Infographics
Historical Infographics
Home & Garden Infographics
Internet Infographics
Law and Legal Infographics
Lifestyle Infographics
Marketing Infographics
Offbeat Infographics
Parenting Infographics
Pets & Animals Infographics
Political Infographics
Shopping Infographics
Sports and Athletic Infographics
Technology Infographics
Transportation Infographics
Travel Infographics
Video Infographics