


Search 12,100+ Infographics!

What Keeping Up With Energy Demand Means to the Power Grid
America’s power demand is surging, but our aging grid can’t keep up. To meet the future, we need smarter, more resilient infrastructure—starting with transformers built here in the United States. Learn more about how what keeping up with energy demand means to the power grid in the following infographic, courtesy of ELSCO.

Understanding Generational and Holiday Shopping Trends
This 2025 Equifax Holiday Spend Trends infographic offers a comprehensive look at the current state of US consumer finances and what retailers and lenders can anticipate in the coming months. Learn more about how to property understand and interpret generational and holiday shopping trends and market research report, courtesy of Equifax.
What Percentage Do Popular Side-Gig Apps Take From Each Sale in the U.S.?
A new article from LLC Attorney.com compiles data on fees collected by some of the most widely used freelance and side gig platforms. It shows how much of each transaction is retained by the app rather than the side-gig worker.
Advances In Office Technology and Upgrades That Replaced Them
The team at Ooma presents a thoughtfully executed and refreshingly clear timeline of office technology advances. It prioritizes readability and structure to show a wide span of technological history without overwhelming the viewer. A linear layout reinforces the idea of technology building on what came before, showing steady progress in a clean presentation that focuses on the facts.
Which Companies Own Which Mattress Brands?
NapLab’s mattress brand ownership infographic is a great example of a chart that makes a complicated topic instantly easy to understand. Their new graphic uses a clean “family tree” layout that clearly labels which mattress labels are owned by which parent companies.
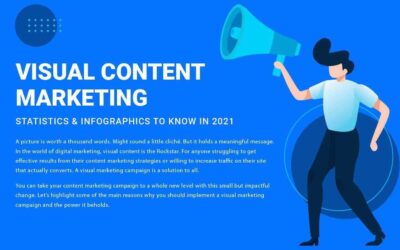
Reasons To Implement a Visual Marketing Campaign
Here is an infographic from Artisticore that highlights the importance and effectiveness of using visual content in marketing strategies. It aims to demonstrate how visual marketing can improve brand engagement, enhance communication, and drive business results.

The Future of AI and Recruitment Software
Check out the follow infographic all about the ins and outs of recruitment software in the following visual deep dive, courtesy of graylink.

30 Statistics About Cutting the Cord in the United States
You’ve probably noticed that many of your friends have cut the cord and given up cable TV and landlines. The Ooma study, Cutting the Cord Statistics in the U.S., shows that millions of Americans have joined the trend of switching from traditional wired services to wireless and Internet-based services.
Which Handyman Home Improvement Projects Have the Biggest Return on Investment?
Ace Handyman Services released a new graphic that’s perfect for homeowners who want to make some upgrades without sinking money into a massive renovation project that will never pay for itself. The team lists the home improvement projects that deliver the biggest bang for your buck. Most of them are simple fixes even beginner DIYers can take on.
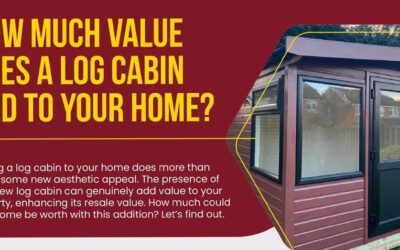
How Much Value Does a Log Cabin Add to Your Home?
A quality garden cabin significantly boosts your property’s resale value and buyer appeal. Well-built log cabins may increase home values by up to 15%, with some research suggesting that they sell at about 10% above asking price. Learn more in the following infographic, courtesy of 1st Choice Leisure Buildings.
What Keeping Up With Energy Demand Means to the Power Grid
America’s power demand is surging, but our aging grid can’t keep up. To meet the future, we need smarter, more resilient infrastructure—starting with transformers built here in the United States. Learn more about how what keeping up with energy demand means to the power grid in the following infographic, courtesy of ELSCO.
Understanding Generational and Holiday Shopping Trends
This 2025 Equifax Holiday Spend Trends infographic offers a comprehensive look at the current state of US consumer finances and what retailers and lenders can anticipate in the coming months. Learn more about how to property understand and interpret generational and holiday shopping trends and market research report, courtesy of Equifax.
What Percentage Do Popular Side-Gig Apps Take From Each Sale in the U.S.?
A new article from LLC Attorney.com compiles data on fees collected by some of the most widely used freelance and side gig platforms. It shows how much of each transaction is retained by the app rather than the side-gig worker.
Advances In Office Technology and Upgrades That Replaced Them
The team at Ooma presents a thoughtfully executed and refreshingly clear timeline of office technology advances. It prioritizes readability and structure to show a wide span of technological history without overwhelming the viewer. A linear layout reinforces the idea of technology building on what came before, showing steady progress in a clean presentation that focuses on the facts.
Which Companies Own Which Mattress Brands?
NapLab’s mattress brand ownership infographic is a great example of a chart that makes a complicated topic instantly easy to understand. Their new graphic uses a clean “family tree” layout that clearly labels which mattress labels are owned by which parent companies.
Reasons To Implement a Visual Marketing Campaign
Here is an infographic from Artisticore that highlights the importance and effectiveness of using visual content in marketing strategies. It aims to demonstrate how visual marketing can improve brand engagement, enhance communication, and drive business results.
The Future of AI and Recruitment Software
Check out the follow infographic all about the ins and outs of recruitment software in the following visual deep dive, courtesy of graylink.
30 Statistics About Cutting the Cord in the United States
You’ve probably noticed that many of your friends have cut the cord and given up cable TV and landlines. The Ooma study, Cutting the Cord Statistics in the U.S., shows that millions of Americans have joined the trend of switching from traditional wired services to wireless and Internet-based services.
Which Handyman Home Improvement Projects Have the Biggest Return on Investment?
Ace Handyman Services released a new graphic that’s perfect for homeowners who want to make some upgrades without sinking money into a massive renovation project that will never pay for itself. The team lists the home improvement projects that deliver the biggest bang for your buck. Most of them are simple fixes even beginner DIYers can take on.
How Much Value Does a Log Cabin Add to Your Home?
A quality garden cabin significantly boosts your property’s resale value and buyer appeal. Well-built log cabins may increase home values by up to 15%, with some research suggesting that they sell at about 10% above asking price. Learn more in the following infographic, courtesy of 1st Choice Leisure Buildings.
Partners


Browse Archives By Category
Animated Infographics
Business Infographics
Career & Jobs Infographics
Education Infographics
Entertainment Industry Infographics
Environmental Infographics
Finance & Money Infographics
Food & Drink Infographics
Health Infographics
Historical Infographics
Home & Garden Infographics
Internet Infographics
Law and Legal Infographics
Lifestyle Infographics
Marketing Infographics
Offbeat Infographics
Parenting Infographics
Pets & Animals Infographics
Political Infographics
Shopping Infographics
Sports and Athletic Infographics
Technology Infographics
Transportation Infographics
Travel Infographics
Video Infographics