


Search 12,100+ Infographics!
Everything You Thought You Knew About Builders is Wrong
Ask someone what a tradesperson is like and you’re likely to get some pretty negative stereotypes. Builders are often portrayed as work-shy cowboys with backward attitudes. On the rare occasion they turn up on time, they are expected to kick start their day with a fry-up followed by several cups of tea. Then it’s off to the pub to watch football.
10 Reasons Ecommerce Business Needs A Social Media Strategy
The following infographic provides ten reasons as to why your ecommerce business needs to have a social media strategy. It also illustrates the importance of having a social media strategy and how it can help evolve your ecommerce business on to the next level.
How Casinos Use Technology
It is always important to develop yourself as the time changes. The same thing applies for the businesses. In this interesting infographic from PokerStars find out how casinos are moving forward with the help of technology.
Movie Cars – You Can Drive
Sometimes it seems like movies were made to show off cars. Some cars are simply so great that they seem ready to drive their way off the screen, or they become iconic by carving out their own place in cinema history. In either case everyone who has been to the cinema has dreamt of driving a car they have witnessed on the big screen.
The Rearranging of Americans’ Living Arrangements
American society is always changing, but it happens so gradually it is hard to notice. If you’re living in a multi-generational home, you aren’t alone. Take a look at how household living arrangements have shifted over the last 40 years and those changes become quite evident in this infographic.
Packing Hacks for Saving Money and Protecting Your Items
Packing does not have to take as long as you might think. There are a lot of safe and helpful tips to help expedite the process and make it as stress free as possible for you and your family. If you are opting to pack yourself, here are some lesser known packing hacks to help make the packing and moving process a little easier.
Flat Belly Made Easier
Is zipping your pants a real struggle? Does your quest for a sexy stomach always hit a bump right about belly-button level? Well, you may not be after six-pack abs, but a flat pooch is something on your mind all the time. In this infographic learn how to get that flat belly.
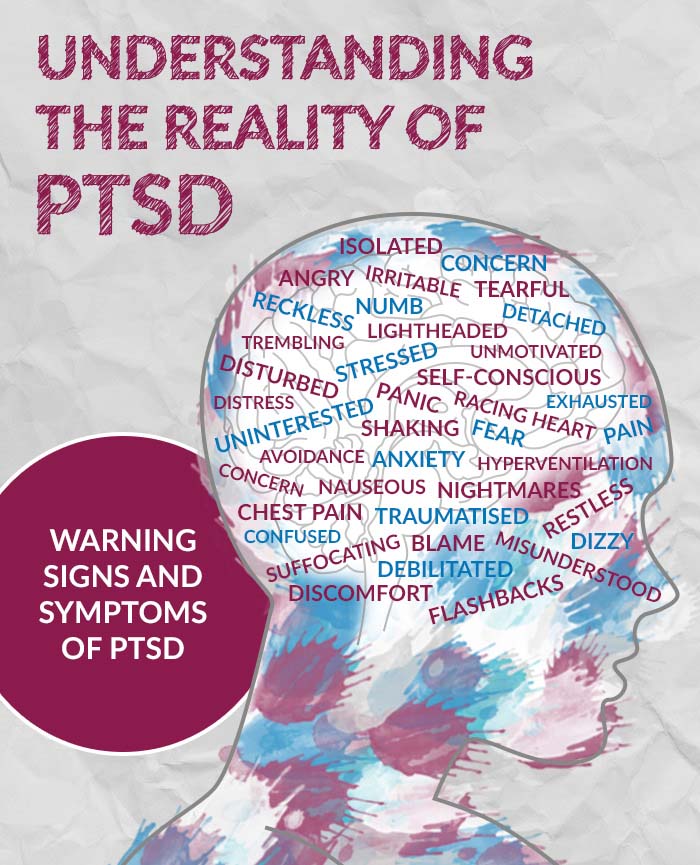
Understanding the Reality of Post-Traumatic Stress Disorder (PTSD)
For those suffering from Post-Traumatic Stress Disorder, life can be turned upside down as they are met with a whirlwind of different feelings and emotions. This guide can help those suffering from PTSD or those close to them, understand the reality of PTSD and what can be done to help towards a full recovery and back to the life you once lived.

Top Gear: Chris Evans vs Jeremy Clarkson
Picking a replacement for Jeremy Clarkson was never going to be an easy task, but you can understand why the BBC plumped for Chris Evans. He’s a petrol-head with a long history of hosting big shows but who still has that all important air of irreverence about him.
Cost of Speeding Around the World
Getting speeding ticket is not a pleasant feeling, especially when you are in the foreign country. Make sure that never happens to you. In this infographic from Avis find out what are the speed limits and fines in countries around the work and be prepared for your trip.
Everything You Thought You Knew About Builders is Wrong
Ask someone what a tradesperson is like and you’re likely to get some pretty negative stereotypes. Builders are often portrayed as work-shy cowboys with backward attitudes. On the rare occasion they turn up on time, they are expected to kick start their day with a fry-up followed by several cups of tea. Then it’s off to the pub to watch football.
10 Reasons Ecommerce Business Needs A Social Media Strategy
The following infographic provides ten reasons as to why your ecommerce business needs to have a social media strategy. It also illustrates the importance of having a social media strategy and how it can help evolve your ecommerce business on to the next level.
How Casinos Use Technology
It is always important to develop yourself as the time changes. The same thing applies for the businesses. In this interesting infographic from PokerStars find out how casinos are moving forward with the help of technology.
Movie Cars – You Can Drive
Sometimes it seems like movies were made to show off cars. Some cars are simply so great that they seem ready to drive their way off the screen, or they become iconic by carving out their own place in cinema history. In either case everyone who has been to the cinema has dreamt of driving a car they have witnessed on the big screen.
The Rearranging of Americans’ Living Arrangements
American society is always changing, but it happens so gradually it is hard to notice. If you’re living in a multi-generational home, you aren’t alone. Take a look at how household living arrangements have shifted over the last 40 years and those changes become quite evident in this infographic.
Packing Hacks for Saving Money and Protecting Your Items
Packing does not have to take as long as you might think. There are a lot of safe and helpful tips to help expedite the process and make it as stress free as possible for you and your family. If you are opting to pack yourself, here are some lesser known packing hacks to help make the packing and moving process a little easier.
Flat Belly Made Easier
Is zipping your pants a real struggle? Does your quest for a sexy stomach always hit a bump right about belly-button level? Well, you may not be after six-pack abs, but a flat pooch is something on your mind all the time. In this infographic learn how to get that flat belly.
Understanding the Reality of Post-Traumatic Stress Disorder (PTSD)
For those suffering from Post-Traumatic Stress Disorder, life can be turned upside down as they are met with a whirlwind of different feelings and emotions. This guide can help those suffering from PTSD or those close to them, understand the reality of PTSD and what can be done to help towards a full recovery and back to the life you once lived.
Top Gear: Chris Evans vs Jeremy Clarkson
Picking a replacement for Jeremy Clarkson was never going to be an easy task, but you can understand why the BBC plumped for Chris Evans. He’s a petrol-head with a long history of hosting big shows but who still has that all important air of irreverence about him.
Cost of Speeding Around the World
Getting speeding ticket is not a pleasant feeling, especially when you are in the foreign country. Make sure that never happens to you. In this infographic from Avis find out what are the speed limits and fines in countries around the work and be prepared for your trip.
Partners


Browse Archives By Category
Animated Infographics
Business Infographics
Career & Jobs Infographics
Education Infographics
Entertainment Industry Infographics
Environmental Infographics
Finance & Money Infographics
Food & Drink Infographics
Health Infographics
Historical Infographics
Home & Garden Infographics
Internet Infographics
Law and Legal Infographics
Lifestyle Infographics
Marketing Infographics
Offbeat Infographics
Parenting Infographics
Pets & Animals Infographics
Political Infographics
Shopping Infographics
Sports and Athletic Infographics
Technology Infographics
Transportation Infographics
Travel Infographics
Video Infographics