


Search 12,100+ Infographics!
Overtime Reform: What it Means for Workers & Businesses
This summer, Barack Obama announced a sizable overtime reform proposal that would bring overtime pay to 40% of American workers. But what does that mean for workers and small businesses? This infographic by FitSmallBusiness.com breaks down the costs and benefits across different jobs and industries. Service, office, and professional jobs look to be most affected should his overtime reform proposal take effect.
The Devil’s Greenhouse
Throwing a wedding bouquet, buying a flower for your lover, stopping to smell the roses… flowers play an important part in our lives. Most of the time, they signify joyful occasions. But sometimes they server a darker purpose. Enter The Devil’s Greenhouse – a collection of the most poisonous flowers from around the world. Capable of stopping a man’s heart and stealing the breath from your lungs, they might look pretty, but they can kill.
Hurting From Hurricanes
Nothing can stop a hurricane – but a solid disaster recovery plan can help to alleviate the aftermath. Residents often suffer financial damage, and even though a good insurance policy may protect against some property damages, lasting emotional trauma takes time to heal.
Tunnel Like El Chapo
For the second time in 15 years Mexico’s most infamous drug lord escaped from a maximum-security prison. Joaquín Guzmán, aka El Chapo or the king of drains and tunnels and his cartel have been credited with building nearly 100 other tunnels on the U.S.-Mexico border, including one he referred to as an “f’n cool tunnel”. This escape tunnel was 12-16 months in the making at a cost of about $5 million dollars.
6 Iconic LGBT Friendly Wedding Venues in London
The capital city of London is home to the most elegant, opulent and also some of the most bizarre wedding venues. It also hosts the most same-sex marriages in the UK. So this infographic showcases some of the most iconic and recognizable LGBT-friendly wedding venues in London.
5 Industries Drastically Changed By The Internet
The Internet has changed everybody’s lives, some for the better, some not so lucky. The global reach of the Internet has meant a big sea change for businesses who’ve seen consumers change the way they shop and how they buy products and services. Some businesses have survived while others haven’t fared so well. Check out this infographic and you’ll see that some businesses have struggled, adapted, changed and survived.
Holiday Shopping Habits 2015
Rubicon Project surveyed 2,009 individuals in the US, UK and Canada to get a detailed look at the consumer habits driving holiday shopping in 2015. The results are visually displayed in the following infographic.
What To Do When Your Fire Alarm Goes Off
It is very easy to panic when your fire alarm goes off. Make sure you know what to do to keep your family and yourself safe during a fire. Draw out a fire escape plan for your home with this helpful infographic from Link Interactive.
Boost Your Mood Using 5 Scientific Decorating Tips
Did you know that your home décor has a lot more influence on you than you thought? The truth is that it can help you to boost your mood. Find out how with the help of this interesting infographic.
Keeping Ambient Temperatures For Healthy Pets
Pet health is dependent on a variety of factors, food, drink, exercise and your love to name a few. You also need to ensure that they are provided with an ambient temperature to help make them flourish. This infographic highlights the importance of your pet avoiding heatstroke during the summer and keeping sufficiently warm in the winter to prevent hypothermia.
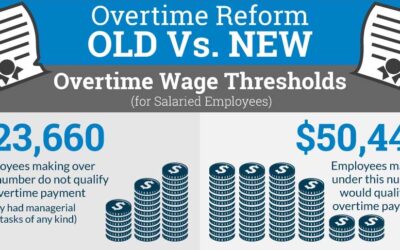
Partners


Browse Archives By Category
Animated Infographics
Business Infographics
Career & Jobs Infographics
Education Infographics
Entertainment Industry Infographics
Environmental Infographics
Finance & Money Infographics
Food & Drink Infographics
Health Infographics
Historical Infographics
Home & Garden Infographics
Internet Infographics
Law and Legal Infographics
Lifestyle Infographics
Marketing Infographics
Offbeat Infographics
Parenting Infographics
Pets & Animals Infographics
Political Infographics
Shopping Infographics
Sports and Athletic Infographics
Technology Infographics
Transportation Infographics
Travel Infographics
Video Infographics