


Search 12,100+ Infographics!

Ultimate Bucket List For Over 50s
It is said that our biggest regrets are about things we didn’t do. Save yourself from regrets and live through some new experiences. In this infographic you will what needs to be on the ultimate bucket list for those over 50s.
30 Garden Plants That Are Harmful for Pets
Pets quite often are our best friends or considered a part of the family and as such we want to protect and keep them safe. Most of us don’t realize just how dangerous our gardens and the general outdoors can be. Have you looked in your back garden and thought, could any of these plants cause harm to my family? Well, the answers is yes!
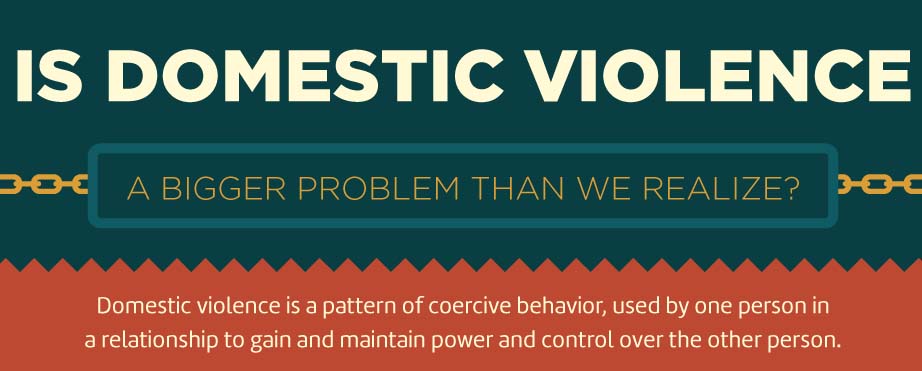
Is Domestic Violence a Bigger Problem Than We Realize?
October is Domestic Violence Awareness Month, and this year it has been filled with reports of incidents involving important figures in sports, government, and more. This media attention has placed a much-needed spotlight on this incredibly important cause – one that as a social worker you must be trained to handle. See the startling statistics on domestic violence in the following infographic .
Interesting Instagram Statistics
Instagram is one of the most popular photo sharing websites with more than 300 million active users. Over 70 million photos are uploaded everyday and more than 1,000 comments are posted per second. Instagram’s popularity lies in its ability to transform mobile camera photos into professional looking images. The Instagram app allows users to transform their photos into stunning images by providing a wide range of filters.
The Rise of Action Cameras
The action camera industry has crossed $3.2 billion market value and it has just taken off. In this infographic, learn who started this phenomenon, the history and rise of action cameras and where you can use them.
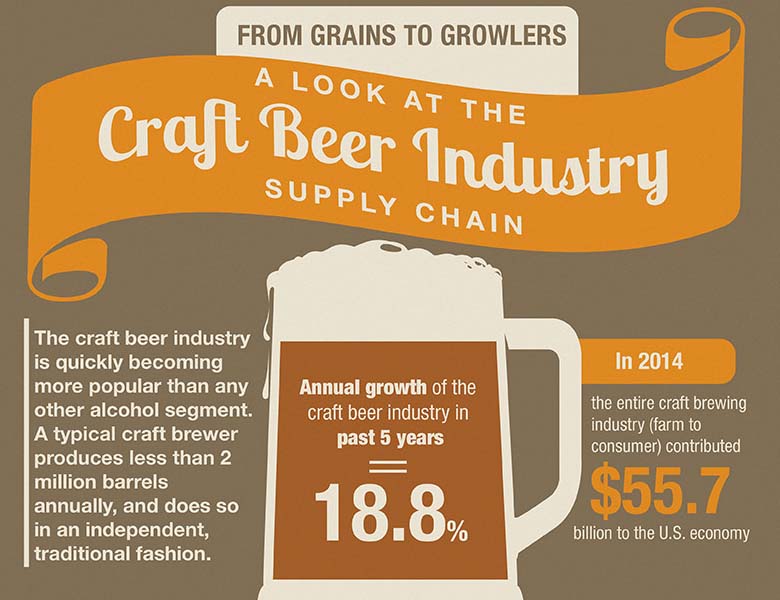
From Grains to Growlers: A Look at the Craft Beer Industry Supply Chain
The craft beer industry is quickly becoming more popular than any other alcohol segment. A typical craft brewer produces less than 2 million barrels annually, and does so in an independent, traditional fashion. From grains to growlers, this infographic takes a look at the craft beer industry supply chain.
The Digital Evolution of Table Games
Have you noticed that as of lately your friendly poker dealer has been replaced by machines and screens? Going digital is the new trend in casino gaming and allows for less experienced user to try the “tables” without the added intimidation. Check out the following infographic to see some changes you’ll likely find in your favorite casino next time you visit.
What It Would Take to Break the Internet
Everyday we use devices and tools that heavily rely on the Internet, but most don’t realize how fragile the Internet really is. From sharks attacking underwater cables to cyber attacks, this infographic from Liquid Networx explores what it would take to break the Internet.
Style High Club: Where Fashion Meets the Skies
Airlines are having top fashion designers create their uniforms these days. In this infographic from the folks at www.cheapflights.com, see some of the the designs and check out the sky styles.
5 Creative Crafting Storage Ideas
Do you shake your head in dismay when you walk into your craft room? Does the state of your supplies make you put off your crafts for another day? It isn’t uncommon for crafty people to let their crafting spaces become disorganized or even messy. Luckily, there are solutions. To get you started, the following infographic has five great ideas.
Ultimate Bucket List For Over 50s
It is said that our biggest regrets are about things we didn’t do. Save yourself from regrets and live through some new experiences. In this infographic you will what needs to be on the ultimate bucket list for those over 50s.
30 Garden Plants That Are Harmful for Pets
Pets quite often are our best friends or considered a part of the family and as such we want to protect and keep them safe. Most of us don’t realize just how dangerous our gardens and the general outdoors can be. Have you looked in your back garden and thought, could any of these plants cause harm to my family? Well, the answers is yes!
Is Domestic Violence a Bigger Problem Than We Realize?
October is Domestic Violence Awareness Month, and this year it has been filled with reports of incidents involving important figures in sports, government, and more. This media attention has placed a much-needed spotlight on this incredibly important cause – one that as a social worker you must be trained to handle. See the startling statistics on domestic violence in the following infographic .
Interesting Instagram Statistics
Instagram is one of the most popular photo sharing websites with more than 300 million active users. Over 70 million photos are uploaded everyday and more than 1,000 comments are posted per second. Instagram’s popularity lies in its ability to transform mobile camera photos into professional looking images. The Instagram app allows users to transform their photos into stunning images by providing a wide range of filters.
The Rise of Action Cameras
The action camera industry has crossed $3.2 billion market value and it has just taken off. In this infographic, learn who started this phenomenon, the history and rise of action cameras and where you can use them.
From Grains to Growlers: A Look at the Craft Beer Industry Supply Chain
The craft beer industry is quickly becoming more popular than any other alcohol segment. A typical craft brewer produces less than 2 million barrels annually, and does so in an independent, traditional fashion. From grains to growlers, this infographic takes a look at the craft beer industry supply chain.
The Digital Evolution of Table Games
Have you noticed that as of lately your friendly poker dealer has been replaced by machines and screens? Going digital is the new trend in casino gaming and allows for less experienced user to try the “tables” without the added intimidation. Check out the following infographic to see some changes you’ll likely find in your favorite casino next time you visit.
What It Would Take to Break the Internet
Everyday we use devices and tools that heavily rely on the Internet, but most don’t realize how fragile the Internet really is. From sharks attacking underwater cables to cyber attacks, this infographic from Liquid Networx explores what it would take to break the Internet.
Style High Club: Where Fashion Meets the Skies
Airlines are having top fashion designers create their uniforms these days. In this infographic from the folks at www.cheapflights.com, see some of the the designs and check out the sky styles.
5 Creative Crafting Storage Ideas
Do you shake your head in dismay when you walk into your craft room? Does the state of your supplies make you put off your crafts for another day? It isn’t uncommon for crafty people to let their crafting spaces become disorganized or even messy. Luckily, there are solutions. To get you started, the following infographic has five great ideas.
Partners


Browse Archives By Category
Animated Infographics
Business Infographics
Career & Jobs Infographics
Education Infographics
Entertainment Industry Infographics
Environmental Infographics
Finance & Money Infographics
Food & Drink Infographics
Health Infographics
Historical Infographics
Home & Garden Infographics
Internet Infographics
Law and Legal Infographics
Lifestyle Infographics
Marketing Infographics
Offbeat Infographics
Parenting Infographics
Pets & Animals Infographics
Political Infographics
Shopping Infographics
Sports and Athletic Infographics
Technology Infographics
Transportation Infographics
Travel Infographics
Video Infographics