


Search 12,100+ Infographics!
Packing Hacks for Saving Money and Protecting Your Items
Packing does not have to take as long as you might think. There are a lot of safe and helpful tips to help expedite the process and make it as stress free as possible for you and your family. If you are opting to pack yourself, here are some lesser known packing hacks to help make the packing and moving process a little easier.
Flat Belly Made Easier
Is zipping your pants a real struggle? Does your quest for a sexy stomach always hit a bump right about belly-button level? Well, you may not be after six-pack abs, but a flat pooch is something on your mind all the time. In this infographic learn how to get that flat belly.
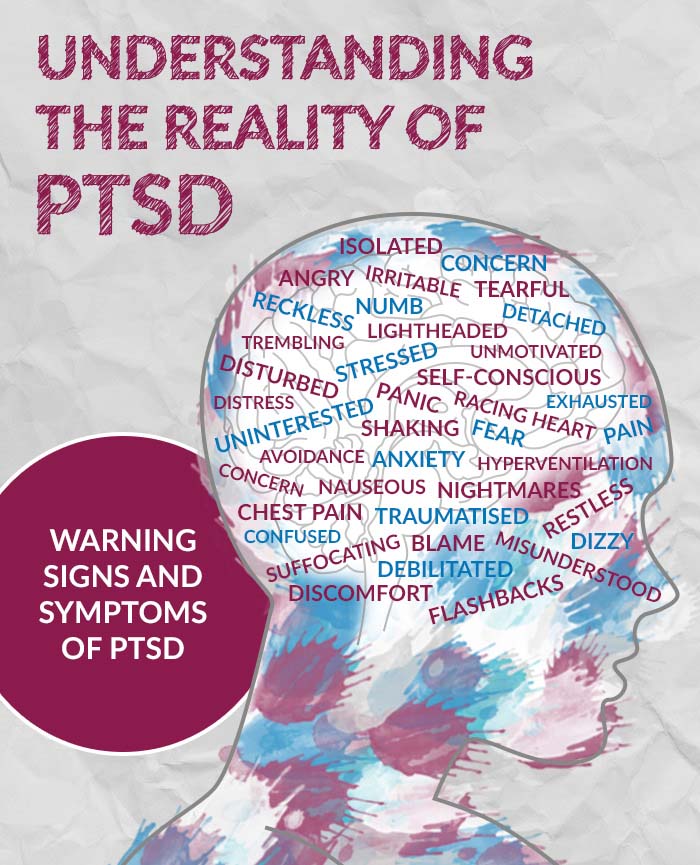
Understanding the Reality of Post-Traumatic Stress Disorder (PTSD)
For those suffering from Post-Traumatic Stress Disorder, life can be turned upside down as they are met with a whirlwind of different feelings and emotions. This guide can help those suffering from PTSD or those close to them, understand the reality of PTSD and what can be done to help towards a full recovery and back to the life you once lived.

Top Gear: Chris Evans vs Jeremy Clarkson
Picking a replacement for Jeremy Clarkson was never going to be an easy task, but you can understand why the BBC plumped for Chris Evans. He’s a petrol-head with a long history of hosting big shows but who still has that all important air of irreverence about him.
Cost of Speeding Around the World
Getting speeding ticket is not a pleasant feeling, especially when you are in the foreign country. Make sure that never happens to you. In this infographic from Avis find out what are the speed limits and fines in countries around the work and be prepared for your trip.

The Complete Guide to Photography for Beginners
Getting started with photography isn’t easy – it requires solid technical foundations as well as a keen eye for visual elements such that help keep a photo balanced. Here is a detailed guide in an effort to introduce beginners to some of the basic concepts of great photography.
How to Become a Wildland Firefighter
If you see yourself in a career that involves a love of nature, grueling labor, unparalleled comradery, and pushing yourself to extremes, then this may be the job for you. A Wildland Firefighter is an expert at preventing, tackling, and extinguishing angry flames that attack our great outdoors. In this infographic are the steps required to begin your career as a Wildland Firefighter.
An A-Z of ‘Untranslatable’ Words
Ever had a feeling that you are missing the perfect word to describe something? Maybe you can find that word in some other language. Check out this infographic by Cheapflights.com.au to learn some awesome “untranslatable” words.
The Dangers of Toxic Air Fresheners and How to Protect Your Family
A lot of today’s commercial floral-scented air fresheners contain harmful toxic chemicals. To avoid the harmful effects caused by these hidden toxic chemicals, the use of natural air fresheners such as natural reed diffusers and scented candles are encouraged. Understand the other ways to protect your family from these toxins with this helpful infographic
8 Beer Hacks You Didn’t Know About
Don’t you hate when you find yourself at a party, with a bottle of beer, but without a bottle opener? Well, now you’ll never have to deal with these problems again. In this interesting infographic you’ll find beer hacks that everybody should know.
Packing Hacks for Saving Money and Protecting Your Items
Packing does not have to take as long as you might think. There are a lot of safe and helpful tips to help expedite the process and make it as stress free as possible for you and your family. If you are opting to pack yourself, here are some lesser known packing hacks to help make the packing and moving process a little easier.
Flat Belly Made Easier
Is zipping your pants a real struggle? Does your quest for a sexy stomach always hit a bump right about belly-button level? Well, you may not be after six-pack abs, but a flat pooch is something on your mind all the time. In this infographic learn how to get that flat belly.
Understanding the Reality of Post-Traumatic Stress Disorder (PTSD)
For those suffering from Post-Traumatic Stress Disorder, life can be turned upside down as they are met with a whirlwind of different feelings and emotions. This guide can help those suffering from PTSD or those close to them, understand the reality of PTSD and what can be done to help towards a full recovery and back to the life you once lived.
Top Gear: Chris Evans vs Jeremy Clarkson
Picking a replacement for Jeremy Clarkson was never going to be an easy task, but you can understand why the BBC plumped for Chris Evans. He’s a petrol-head with a long history of hosting big shows but who still has that all important air of irreverence about him.
Cost of Speeding Around the World
Getting speeding ticket is not a pleasant feeling, especially when you are in the foreign country. Make sure that never happens to you. In this infographic from Avis find out what are the speed limits and fines in countries around the work and be prepared for your trip.
The Complete Guide to Photography for Beginners
Getting started with photography isn’t easy – it requires solid technical foundations as well as a keen eye for visual elements such that help keep a photo balanced. Here is a detailed guide in an effort to introduce beginners to some of the basic concepts of great photography.
How to Become a Wildland Firefighter
If you see yourself in a career that involves a love of nature, grueling labor, unparalleled comradery, and pushing yourself to extremes, then this may be the job for you. A Wildland Firefighter is an expert at preventing, tackling, and extinguishing angry flames that attack our great outdoors. In this infographic are the steps required to begin your career as a Wildland Firefighter.
An A-Z of ‘Untranslatable’ Words
Ever had a feeling that you are missing the perfect word to describe something? Maybe you can find that word in some other language. Check out this infographic by Cheapflights.com.au to learn some awesome “untranslatable” words.
The Dangers of Toxic Air Fresheners and How to Protect Your Family
A lot of today’s commercial floral-scented air fresheners contain harmful toxic chemicals. To avoid the harmful effects caused by these hidden toxic chemicals, the use of natural air fresheners such as natural reed diffusers and scented candles are encouraged. Understand the other ways to protect your family from these toxins with this helpful infographic
8 Beer Hacks You Didn’t Know About
Don’t you hate when you find yourself at a party, with a bottle of beer, but without a bottle opener? Well, now you’ll never have to deal with these problems again. In this interesting infographic you’ll find beer hacks that everybody should know.
Partners


Browse Archives By Category
Animated Infographics
Business Infographics
Career & Jobs Infographics
Education Infographics
Entertainment Industry Infographics
Environmental Infographics
Finance & Money Infographics
Food & Drink Infographics
Health Infographics
Historical Infographics
Home & Garden Infographics
Internet Infographics
Law and Legal Infographics
Lifestyle Infographics
Marketing Infographics
Offbeat Infographics
Parenting Infographics
Pets & Animals Infographics
Political Infographics
Shopping Infographics
Sports and Athletic Infographics
Technology Infographics
Transportation Infographics
Travel Infographics
Video Infographics