


Search 12,100+ Infographics!
8 Ways to Save Money in Vegas
Going on a vacation can be really expensive. Don’t go over your budget while visiting Sin City (Las Vegas). Find out how you can save money with the help of this infographic from the folks at Pokerstars.
The World’s Biggest Historical Buildings
In any modern society, buildings are used to show the power and wealth of the ruling class. This infographic looks at some of the biggest historical buildings that remain standing today. How many have you visited?
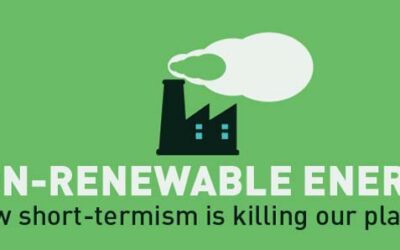
Non-Renewable Energy – How Short-Termism is Killing Our Planet
Fossil fuels currently drive around 90% of energy production levels. Latest figures suggest that our most plentiful resource, coal, has a maximum lifespan of 250 years, with oil and natural gas falling much shorter. This infographic outlines how a dependence on fossil fuels is putting the long term future of our planet in jeopardy.
Travel Tips for Travelers with Hypertension
High blood pressure or hypertension afflicts approx. about 75 million people each year. There are potential risks involved for travelers traveling with this medical condition, however, there are various ways to prevent, take precaution against this potential health conditions while traveling. VisitorsCoverage has created the following infographics to educate travelers with high blood pressure about various travel tips that can make their travel seamless.
Home Improvement Etiquitte
TheBathOutlet.com has put together the following guide to try and make decisions a little easier for a homeowner the next time they hire one of the following: a general contractor, painter, electrician, plumber or interior decorator.
5 Common Roadside Emergencies And How To Deal With Them
Each year a large number of drivers experience some form of roadside emergencies, but only a few of them is prepared to deal with them. Don’t be one of them. With the help of this informative infographic you will be prepared to deal with most common roadside emergencies.
13 Interior Design Styles From Around The World
Many factors influence the interior design of homes in different cultures. From the color-scheme to the level of clutter, national traditions continue to play a vital role in the choices people make when decorating homes across the world. In this infographic, see 13 interior design styles from around the world.
Data Behind the Wheel: An Analysis of How We Drive
Data is everywhere, and no where is more prevalent than in traffic. Every single day millions of people drive, and with each of those people, data is being collected. Here is an infographic from Experian Data Quality that includes data on traffic congestion, speeding, collisions, fatalities, police chases both in the United States and abroad.
Allergies Attack America!
Summer and fall are some of our favorite seasons – but for those of us with environmental allergies they can be a real pain. You don’t have to feel alone though – allergies are on the rise in America, and more people than ever before can sympathize with a runny nose, watery eyes, itchy skin, hives, and more. Like Frankenstein’s monster or a zombie, allergies always rise again to terrorize us when we’re at our most vulnerable.
How to Cycle Like a Local in Amsterdam
Although the cycling rules are already well known, they are still somewhat different from town to town. It is always best to prepare to make sure you don’t look ignorant while cycling in some foreign country or town. In this infographic find out everything about cycling in Amsterdam and impress everyone with your skills.
8 Ways to Save Money in Vegas
Going on a vacation can be really expensive. Don’t go over your budget while visiting Sin City (Las Vegas). Find out how you can save money with the help of this infographic from the folks at Pokerstars.
The World’s Biggest Historical Buildings
In any modern society, buildings are used to show the power and wealth of the ruling class. This infographic looks at some of the biggest historical buildings that remain standing today. How many have you visited?
Non-Renewable Energy – How Short-Termism is Killing Our Planet
Fossil fuels currently drive around 90% of energy production levels. Latest figures suggest that our most plentiful resource, coal, has a maximum lifespan of 250 years, with oil and natural gas falling much shorter. This infographic outlines how a dependence on fossil fuels is putting the long term future of our planet in jeopardy.
Travel Tips for Travelers with Hypertension
High blood pressure or hypertension afflicts approx. about 75 million people each year. There are potential risks involved for travelers traveling with this medical condition, however, there are various ways to prevent, take precaution against this potential health conditions while traveling. VisitorsCoverage has created the following infographics to educate travelers with high blood pressure about various travel tips that can make their travel seamless.
Home Improvement Etiquitte
TheBathOutlet.com has put together the following guide to try and make decisions a little easier for a homeowner the next time they hire one of the following: a general contractor, painter, electrician, plumber or interior decorator.
5 Common Roadside Emergencies And How To Deal With Them
Each year a large number of drivers experience some form of roadside emergencies, but only a few of them is prepared to deal with them. Don’t be one of them. With the help of this informative infographic you will be prepared to deal with most common roadside emergencies.
13 Interior Design Styles From Around The World
Many factors influence the interior design of homes in different cultures. From the color-scheme to the level of clutter, national traditions continue to play a vital role in the choices people make when decorating homes across the world. In this infographic, see 13 interior design styles from around the world.
Data Behind the Wheel: An Analysis of How We Drive
Data is everywhere, and no where is more prevalent than in traffic. Every single day millions of people drive, and with each of those people, data is being collected. Here is an infographic from Experian Data Quality that includes data on traffic congestion, speeding, collisions, fatalities, police chases both in the United States and abroad.
Allergies Attack America!
Summer and fall are some of our favorite seasons – but for those of us with environmental allergies they can be a real pain. You don’t have to feel alone though – allergies are on the rise in America, and more people than ever before can sympathize with a runny nose, watery eyes, itchy skin, hives, and more. Like Frankenstein’s monster or a zombie, allergies always rise again to terrorize us when we’re at our most vulnerable.
How to Cycle Like a Local in Amsterdam
Although the cycling rules are already well known, they are still somewhat different from town to town. It is always best to prepare to make sure you don’t look ignorant while cycling in some foreign country or town. In this infographic find out everything about cycling in Amsterdam and impress everyone with your skills.
Partners


Browse Archives By Category
Animated Infographics
Business Infographics
Career & Jobs Infographics
Education Infographics
Entertainment Industry Infographics
Environmental Infographics
Finance & Money Infographics
Food & Drink Infographics
Health Infographics
Historical Infographics
Home & Garden Infographics
Internet Infographics
Law and Legal Infographics
Lifestyle Infographics
Marketing Infographics
Offbeat Infographics
Parenting Infographics
Pets & Animals Infographics
Political Infographics
Shopping Infographics
Sports and Athletic Infographics
Technology Infographics
Transportation Infographics
Travel Infographics
Video Infographics