


Search 12,100+ Infographics!
Nature’s Candy: The Bountiful Benefits of Fruit
Snacking at work doesn’t have to be unhealthy. Keeping heart-healthy, wholesome snacks nearby will help your employees feel and perform their best. Your staff will be driven in ways you’ve never seen before by doing something as simple as ordering a fresh fruit box for the break room on a regular basis. Check out this infographic to gain a better understanding of how fruit compares to vending machine items.
The Evolution Of The American Home
In this infographic, examine the evolution of the newly constructed American home. In most instances, comparisons were made between homes built in 1994 and 2014. However, in some cases (based on the availability of data), comparisons were made homes built in 2004, 2009 or 2010 and homes built in 2014.
5 Web Design Blunders and Ways To Remedy
Many publishers tend to be hesitant when adding display advertising to their website. Are you a publisher nervous about hurting your user’s experience when placing ads on your page but want to make money? The good news is, you can have a clean and user-friendly site while making money on clutter-free display advertising. sovrn Holdings has created this simple infographic to show publishers that they can make money but avoid hurting their user experience.
The New Sports Experience and How Wi-Fi is Changing the Game
Welcome to the new American pastime: Baseball, hot dogs and Wi-Fi. Digital Element has released a new infographic to show how increasingly more sports stadiums are embracing the use of Wi-Fi in their venues and how businesses can use targeted mobile marketing campaigns to reach these avid sports fans.
9 Awesome, Eco-Friendly Cleaning Tips for Your Bedroom
You spend a large part of each day in the bedroom, and you certainly want it to be clean. This can be achieved without using the number of products that contain harmful chemicals. Learn how to do that with the help of this infographic.
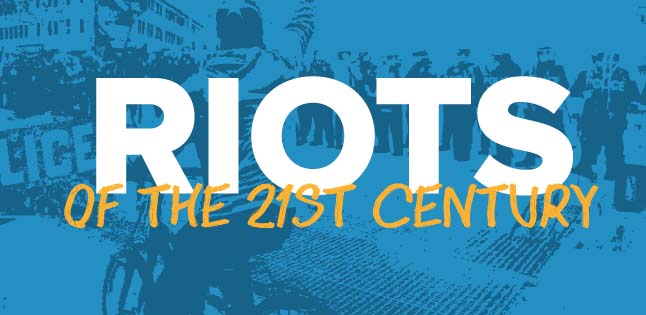
Riots of the 21st Century
Historically, riots have left us with more questions than answers and continue to divide the population. Why does this happen? What is the breaking point that turns a peaceful demonstration into a violent situation? What are the causes and consequences of rioting? Can they be predicted or prevented? The misinformation that often accompanies rioting only makes these questions more difficult to answer.
Ways to Organize Your Writing Cabinet
Everyone who writes books, creates articles for blogs, or distributes content on the Web understands how much a workplace can influence creativity and productivity. Organizing a workplace can become a real challenge, especially when you don’t know or understand all nuances to keep in mind. Your writing cabinet organization becomes easier with this cheat sheet.
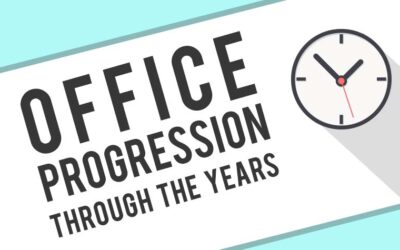
Office Technology Through the Years
The look, feel and design of office buildings and work spaces has changed drastically over the last few decades. Suddath Workplace Solutions latest infographic highlights the major changes in offices during the last 50 years.
7 Habits of Highly Effective Homeowners
Finally you have managed to purchase your dream home. But what do you know about responsibilities that come with owning a house? In this infographic you will discover useful tips that will help you to make your life as a homeowner a lot easier.

Habits of a Festival Goer
Have you ever wondered the minutiae of what makes up the average festival experience? Speculated as to what’s the nation’s favorite festival? Or pondered on how many of us are lucky enough to knock boots in the fields? Here is Skiddle’s summer breakdown of the habits of a festival goer.
Nature’s Candy: The Bountiful Benefits of Fruit
Snacking at work doesn’t have to be unhealthy. Keeping heart-healthy, wholesome snacks nearby will help your employees feel and perform their best. Your staff will be driven in ways you’ve never seen before by doing something as simple as ordering a fresh fruit box for the break room on a regular basis. Check out this infographic to gain a better understanding of how fruit compares to vending machine items.
The Evolution Of The American Home
In this infographic, examine the evolution of the newly constructed American home. In most instances, comparisons were made between homes built in 1994 and 2014. However, in some cases (based on the availability of data), comparisons were made homes built in 2004, 2009 or 2010 and homes built in 2014.
5 Web Design Blunders and Ways To Remedy
Many publishers tend to be hesitant when adding display advertising to their website. Are you a publisher nervous about hurting your user’s experience when placing ads on your page but want to make money? The good news is, you can have a clean and user-friendly site while making money on clutter-free display advertising. sovrn Holdings has created this simple infographic to show publishers that they can make money but avoid hurting their user experience.
The New Sports Experience and How Wi-Fi is Changing the Game
Welcome to the new American pastime: Baseball, hot dogs and Wi-Fi. Digital Element has released a new infographic to show how increasingly more sports stadiums are embracing the use of Wi-Fi in their venues and how businesses can use targeted mobile marketing campaigns to reach these avid sports fans.
9 Awesome, Eco-Friendly Cleaning Tips for Your Bedroom
You spend a large part of each day in the bedroom, and you certainly want it to be clean. This can be achieved without using the number of products that contain harmful chemicals. Learn how to do that with the help of this infographic.
Riots of the 21st Century
Historically, riots have left us with more questions than answers and continue to divide the population. Why does this happen? What is the breaking point that turns a peaceful demonstration into a violent situation? What are the causes and consequences of rioting? Can they be predicted or prevented? The misinformation that often accompanies rioting only makes these questions more difficult to answer.
Ways to Organize Your Writing Cabinet
Everyone who writes books, creates articles for blogs, or distributes content on the Web understands how much a workplace can influence creativity and productivity. Organizing a workplace can become a real challenge, especially when you don’t know or understand all nuances to keep in mind. Your writing cabinet organization becomes easier with this cheat sheet.
Office Technology Through the Years
The look, feel and design of office buildings and work spaces has changed drastically over the last few decades. Suddath Workplace Solutions latest infographic highlights the major changes in offices during the last 50 years.
7 Habits of Highly Effective Homeowners
Finally you have managed to purchase your dream home. But what do you know about responsibilities that come with owning a house? In this infographic you will discover useful tips that will help you to make your life as a homeowner a lot easier.
Habits of a Festival Goer
Have you ever wondered the minutiae of what makes up the average festival experience? Speculated as to what’s the nation’s favorite festival? Or pondered on how many of us are lucky enough to knock boots in the fields? Here is Skiddle’s summer breakdown of the habits of a festival goer.
Partners


Browse Archives By Category
Animated Infographics
Business Infographics
Career & Jobs Infographics
Education Infographics
Entertainment Industry Infographics
Environmental Infographics
Finance & Money Infographics
Food & Drink Infographics
Health Infographics
Historical Infographics
Home & Garden Infographics
Internet Infographics
Law and Legal Infographics
Lifestyle Infographics
Marketing Infographics
Offbeat Infographics
Parenting Infographics
Pets & Animals Infographics
Political Infographics
Shopping Infographics
Sports and Athletic Infographics
Technology Infographics
Transportation Infographics
Travel Infographics
Video Infographics