


Search 12,100+ Infographics!
Selfie Culture Among Generations
Selfies are the raging trend and a study was recently conducted to find out which of the generations engage the most in taking selfies. The results of the study were quite predictable as they stated that the younger generation of today engages the most in taking...
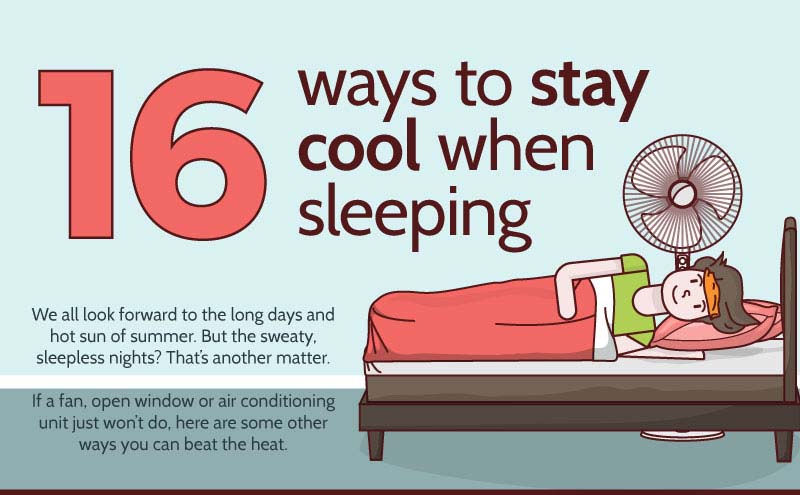
16 Ways To Stay Cool When Sleeping
Warm summer weather is brilliant, but it’s not so good when you’re trying to get to sleep at night. Sleeping in warm weather is incredibly uncomfortable and can mean you don’t get the sleep you need. This infographic lists 16 ways you can keep cool when sleeping so you can get a better night’s rest.
Millennials and Home Buying Trends
Despite living through the housing bust, the majority of Millennials are excited about buying a home in the future, but not without some individualism and technology compatibility. In this infographic, Porch looks at millennials and current home buying trends.
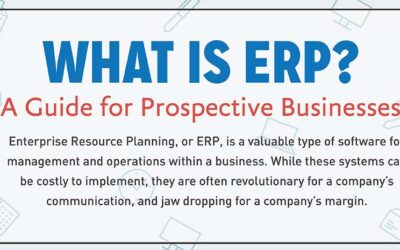
What is ERP? A Guide for Prospective Businesses
Enterprise Resource Planning (ERP) is a daunting subject for business owners. There are many components to it that may seems confusing, overwhelming or downright insane. Luckily, AlfaPeople developed an infographic guide that breaks down the various components of Enterprise Resource Planning based on your industry. Check it out for a clear view on what ERP entails and how it can make your life easier.
Which Stores Sell the Most Apple Products?
When we think of Apple products, most of us flash to those glass and metal museums they call an Apple store. But is that actually where the most Apple merchandise changes hands? Turns out there are many different retailers that move a huge number of Apple products every year. And most folks are more likely to buy their new iPhone or Apple Watch at a Best Buy than at a Apple retail outlet.
Nature’s Candy: The Bountiful Benefits of Fruit
Snacking at work doesn’t have to be unhealthy. Keeping heart-healthy, wholesome snacks nearby will help your employees feel and perform their best. Your staff will be driven in ways you’ve never seen before by doing something as simple as ordering a fresh fruit box for the break room on a regular basis. Check out this infographic to gain a better understanding of how fruit compares to vending machine items.
The Evolution Of The American Home
In this infographic, examine the evolution of the newly constructed American home. In most instances, comparisons were made between homes built in 1994 and 2014. However, in some cases (based on the availability of data), comparisons were made homes built in 2004, 2009 or 2010 and homes built in 2014.
5 Web Design Blunders and Ways To Remedy
Many publishers tend to be hesitant when adding display advertising to their website. Are you a publisher nervous about hurting your user’s experience when placing ads on your page but want to make money? The good news is, you can have a clean and user-friendly site while making money on clutter-free display advertising. sovrn Holdings has created this simple infographic to show publishers that they can make money but avoid hurting their user experience.
The New Sports Experience and How Wi-Fi is Changing the Game
Welcome to the new American pastime: Baseball, hot dogs and Wi-Fi. Digital Element has released a new infographic to show how increasingly more sports stadiums are embracing the use of Wi-Fi in their venues and how businesses can use targeted mobile marketing campaigns to reach these avid sports fans.
9 Awesome, Eco-Friendly Cleaning Tips for Your Bedroom
You spend a large part of each day in the bedroom, and you certainly want it to be clean. This can be achieved without using the number of products that contain harmful chemicals. Learn how to do that with the help of this infographic.
Selfie Culture Among Generations
Selfies are the raging trend and a study was recently conducted to find out which of the generations engage the most in taking selfies. The results of the study were quite predictable as they stated that the younger generation of today engages the most in taking...
16 Ways To Stay Cool When Sleeping
Warm summer weather is brilliant, but it’s not so good when you’re trying to get to sleep at night. Sleeping in warm weather is incredibly uncomfortable and can mean you don’t get the sleep you need. This infographic lists 16 ways you can keep cool when sleeping so you can get a better night’s rest.
Millennials and Home Buying Trends
Despite living through the housing bust, the majority of Millennials are excited about buying a home in the future, but not without some individualism and technology compatibility. In this infographic, Porch looks at millennials and current home buying trends.
What is ERP? A Guide for Prospective Businesses
Enterprise Resource Planning (ERP) is a daunting subject for business owners. There are many components to it that may seems confusing, overwhelming or downright insane. Luckily, AlfaPeople developed an infographic guide that breaks down the various components of Enterprise Resource Planning based on your industry. Check it out for a clear view on what ERP entails and how it can make your life easier.
Which Stores Sell the Most Apple Products?
When we think of Apple products, most of us flash to those glass and metal museums they call an Apple store. But is that actually where the most Apple merchandise changes hands? Turns out there are many different retailers that move a huge number of Apple products every year. And most folks are more likely to buy their new iPhone or Apple Watch at a Best Buy than at a Apple retail outlet.
Nature’s Candy: The Bountiful Benefits of Fruit
Snacking at work doesn’t have to be unhealthy. Keeping heart-healthy, wholesome snacks nearby will help your employees feel and perform their best. Your staff will be driven in ways you’ve never seen before by doing something as simple as ordering a fresh fruit box for the break room on a regular basis. Check out this infographic to gain a better understanding of how fruit compares to vending machine items.
The Evolution Of The American Home
In this infographic, examine the evolution of the newly constructed American home. In most instances, comparisons were made between homes built in 1994 and 2014. However, in some cases (based on the availability of data), comparisons were made homes built in 2004, 2009 or 2010 and homes built in 2014.
5 Web Design Blunders and Ways To Remedy
Many publishers tend to be hesitant when adding display advertising to their website. Are you a publisher nervous about hurting your user’s experience when placing ads on your page but want to make money? The good news is, you can have a clean and user-friendly site while making money on clutter-free display advertising. sovrn Holdings has created this simple infographic to show publishers that they can make money but avoid hurting their user experience.
The New Sports Experience and How Wi-Fi is Changing the Game
Welcome to the new American pastime: Baseball, hot dogs and Wi-Fi. Digital Element has released a new infographic to show how increasingly more sports stadiums are embracing the use of Wi-Fi in their venues and how businesses can use targeted mobile marketing campaigns to reach these avid sports fans.
9 Awesome, Eco-Friendly Cleaning Tips for Your Bedroom
You spend a large part of each day in the bedroom, and you certainly want it to be clean. This can be achieved without using the number of products that contain harmful chemicals. Learn how to do that with the help of this infographic.
Partners


Browse Archives By Category
Animated Infographics
Business Infographics
Career & Jobs Infographics
Education Infographics
Entertainment Industry Infographics
Environmental Infographics
Finance & Money Infographics
Food & Drink Infographics
Health Infographics
Historical Infographics
Home & Garden Infographics
Internet Infographics
Law and Legal Infographics
Lifestyle Infographics
Marketing Infographics
Offbeat Infographics
Parenting Infographics
Pets & Animals Infographics
Political Infographics
Shopping Infographics
Sports and Athletic Infographics
Technology Infographics
Transportation Infographics
Travel Infographics
Video Infographics