


Search 12,100+ Infographics!
Malta: Why It’s Europe’s Top Off The Radar Travel Destination
Sitting square in the turquoise waters of the Mediterranean sits the 316 square km Maltese archipelago, commonly known as Malta. It’s quite possibly the most beautiful and relaxing island hide away in Europe. In fact 1 out of 4 people don’t even have a clue where in the world Malta is! This infographic shows you exactly why you need to book a flight there.
17 Ways Technology Could Be Used To Take Over The World
The world has never been more connected, prosperous and healthy. Due in no small part to the development and spread of wondrous technologies around the world. But what if you chose to take over the world instead of helping it? Which technologies would be best to use in your arsenal? This infographic digs into the most powerful technologies, from the funny to the scary.
Tomorrow’s Intelligent On-Demand City
We live in an on-demand world defined by smart mobile devices, big data and the sharing economy, but today’s on-demand world is still supply-driven – constrained by the availability of resources and the intelligence of our decision making. But what if those constraints disappeared? BoldIQ sets its vision for how dynamic operational optimization software can make “Tomorrow’s Intelligent On-Demand City” possible today.
What’s In a Fad Diet?
This infographic, published by Nursing@Simmons: FNP Program at Simmons College details some of the components of popular “fad” diets. The graphic includes some statistics about American dietary habits and food faddism in the United States.

How To Display Art In Your Home
Artwork can really change the look of every room. But, it is not easy to decide where to hang it to get best results. Luckily, in this infographic you will get all the advice you need for displaying art in your home.

Email Engagement vs Social Media
Devesh Design looked into stats complied by reliable sources like McKinsey & Company and Word Stream, to compare engagement between email marketing and social media. It turns out email absolutely dominates Twitter and Facebook. Explore this idea further in the following infographic.
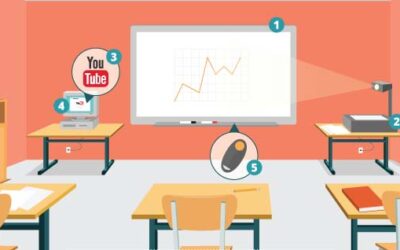
An Evolutionary Look at Tech in the Classroom
Technology’s role in the classroom has drastically increased in recent years – with technology funding jumping from around $800 million in the early 2000s to nearly $12 billion in 2015. With wireless connectivity, tablets, and video conferencing, classrooms are beginning to look less like rooms in a school building and more like the bridge of the Enterprise every day.
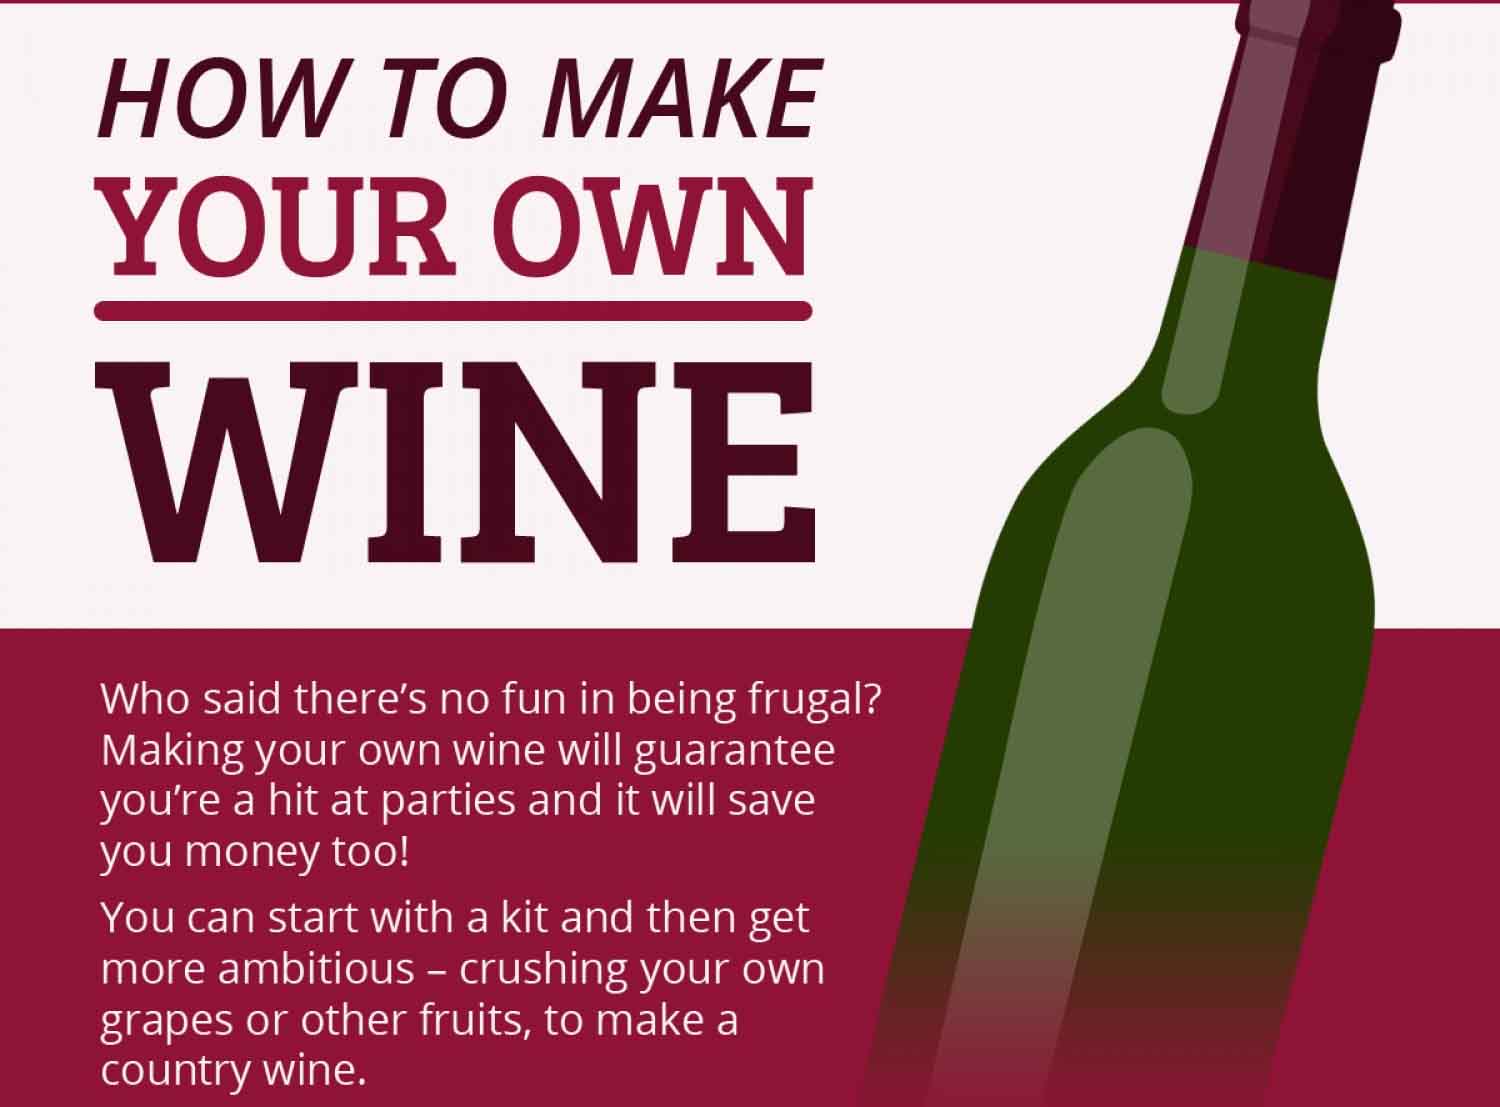
How to Make Your Own Wine
We all love wine, and with a growing trend for home-grown and home-cooked foods, why not try your hand at making your own wine too? This infographic will tell you everything you need to know about making the perfect wine.

How to Repurpose Your Content Correctly
In the following infographic, discover why you should re-purpose content, why Twitter should be main a focus, and learn 6 easy ways to re-purpose content and 4 tools you can use. Get started on awesome content re-purposing right away with this aid.
14 Bizarre Ingredients Hidden in Your Food Labels
With the growing awareness about diseases related to unhealthy nutrition, there’s been a steady increase in the number of people who read food labels when they go shopping for food. Food packaging labels are mostly pretty transparent when one knows how to read them. However, even if we know the optimal amount of calories, fibers, sugars, fats, proteins, vitamins and minerals that we should intake daily, and plan our diet accordingly, there are still some mysterious things on food labels that hide important information from us.
Malta: Why It’s Europe’s Top Off The Radar Travel Destination
Sitting square in the turquoise waters of the Mediterranean sits the 316 square km Maltese archipelago, commonly known as Malta. It’s quite possibly the most beautiful and relaxing island hide away in Europe. In fact 1 out of 4 people don’t even have a clue where in the world Malta is! This infographic shows you exactly why you need to book a flight there.
17 Ways Technology Could Be Used To Take Over The World
The world has never been more connected, prosperous and healthy. Due in no small part to the development and spread of wondrous technologies around the world. But what if you chose to take over the world instead of helping it? Which technologies would be best to use in your arsenal? This infographic digs into the most powerful technologies, from the funny to the scary.
Tomorrow’s Intelligent On-Demand City
We live in an on-demand world defined by smart mobile devices, big data and the sharing economy, but today’s on-demand world is still supply-driven – constrained by the availability of resources and the intelligence of our decision making. But what if those constraints disappeared? BoldIQ sets its vision for how dynamic operational optimization software can make “Tomorrow’s Intelligent On-Demand City” possible today.
What’s In a Fad Diet?
This infographic, published by Nursing@Simmons: FNP Program at Simmons College details some of the components of popular “fad” diets. The graphic includes some statistics about American dietary habits and food faddism in the United States.
How To Display Art In Your Home
Artwork can really change the look of every room. But, it is not easy to decide where to hang it to get best results. Luckily, in this infographic you will get all the advice you need for displaying art in your home.
Email Engagement vs Social Media
Devesh Design looked into stats complied by reliable sources like McKinsey & Company and Word Stream, to compare engagement between email marketing and social media. It turns out email absolutely dominates Twitter and Facebook. Explore this idea further in the following infographic.
An Evolutionary Look at Tech in the Classroom
Technology’s role in the classroom has drastically increased in recent years – with technology funding jumping from around $800 million in the early 2000s to nearly $12 billion in 2015. With wireless connectivity, tablets, and video conferencing, classrooms are beginning to look less like rooms in a school building and more like the bridge of the Enterprise every day.
How to Make Your Own Wine
We all love wine, and with a growing trend for home-grown and home-cooked foods, why not try your hand at making your own wine too? This infographic will tell you everything you need to know about making the perfect wine.
How to Repurpose Your Content Correctly
In the following infographic, discover why you should re-purpose content, why Twitter should be main a focus, and learn 6 easy ways to re-purpose content and 4 tools you can use. Get started on awesome content re-purposing right away with this aid.
14 Bizarre Ingredients Hidden in Your Food Labels
With the growing awareness about diseases related to unhealthy nutrition, there’s been a steady increase in the number of people who read food labels when they go shopping for food. Food packaging labels are mostly pretty transparent when one knows how to read them. However, even if we know the optimal amount of calories, fibers, sugars, fats, proteins, vitamins and minerals that we should intake daily, and plan our diet accordingly, there are still some mysterious things on food labels that hide important information from us.
Partners


Browse Archives By Category
Animated Infographics
Business Infographics
Career & Jobs Infographics
Education Infographics
Entertainment Industry Infographics
Environmental Infographics
Finance & Money Infographics
Food & Drink Infographics
Health Infographics
Historical Infographics
Home & Garden Infographics
Internet Infographics
Law and Legal Infographics
Lifestyle Infographics
Marketing Infographics
Offbeat Infographics
Parenting Infographics
Pets & Animals Infographics
Political Infographics
Shopping Infographics
Sports and Athletic Infographics
Technology Infographics
Transportation Infographics
Travel Infographics
Video Infographics