


Search 12,100+ Infographics!

How Changing Interest Rates Affect Homebuyers
Interest rate fluctuations can affect the housing market in many ways. Take a look at this infographic, which explains what you should know about interest rate fluctuations before you get a mortgage.
Cooking Oils Guide
This infographic highlights some really interesting information about various types of cooking oils. It also gives some tips on how to store different type of cooking oils, their classification as well as their benefits.
Naturally Beautiful Skincare
We all want beautiful skin. But we may not be paying attention to the nasty chemicals lurking in so many skincare products. This visual guide to beautiful skin details the products to avoid (and why they’re dangerous), as well as natural alternatives. It also suggests homemade fixes for whitening teeth, preventing and softening wrinkles, and getting strong and healthy hair.
How Much Do Pets Sleep?
We all hear about the “magic eight hours” that humans should get, but how much does everyone, and everything, really sleep? Here, this infographic takes a look at dogs, cats, rabbits, birds, fish, hamsters and humans and compares the sleeping patterns.
Reactive Attachment Disorder
Reactive attachment disorder is a serious condition that some children and teens must live with. Finding ways to work with this disorder can help teens become very successful adults. Enjoy this infographic that explains how parents can make a difference in the lives of their children.
China Travel Guide
In many ways China is the “Poster Child” of Asia. Steeped in history, with more than 5,000 years of it, rooted in tradition, and rapidly globalizing, few countries in Asia, or the world, are as dynamic as China. While it would be nearly impossible to create a comprehensive list of things you need to know or will invariably learn on your own while planning your first tour to China, this infographic cuts through the haze to inform perspective travelers of the basics they’ll need to know to get their travel planning off on proper footing.

The Ultimate SEO Checklist
Doing SEO is a lot of work. Fortunately, this infographic from Leapfroggr simplifies at least one part of it by giving you a comprehensive checklist of everything you need to do to promote your site or brand online.
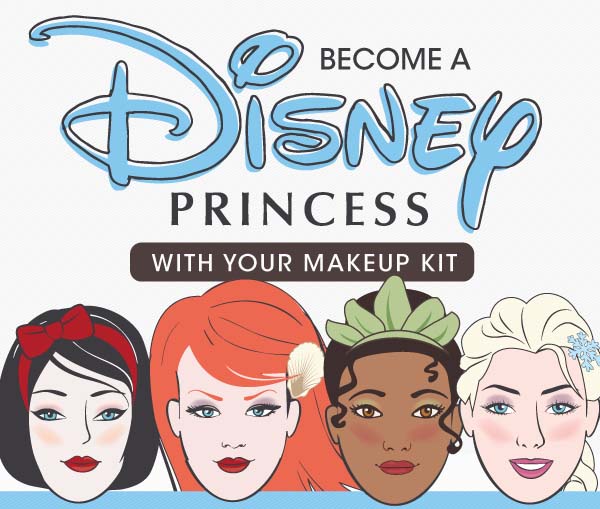
Become a Disney Princess With Your Makeup Kit
If you’ve ever wished upon a star that you could look like your favorite fairy tale princess, you’re not alone. Just follow some simple makeup and styling steps to capture the essence of your favorite heroine, using the easy tips in this infographic from Ogle School.
America’s Population Explosion: Where Are We Packing It Up And Packing It In?
Check out America’s fastest growing metropolitan areas in this infographic from Sparefoot. You might be surprised which cities are experiencing the most growth!
Anatomy of a Volleyball Player
Volleyball plays often come down to split-second reactions. Wearing the right gear can be the difference between a victory and defeat. Avoid injury and dominate the competition with this volleyball gear buying guide. Refer to the following infographic to learn more about the most common protective gear for those injuries that are prevalent on the gym floor.
How Changing Interest Rates Affect Homebuyers
Interest rate fluctuations can affect the housing market in many ways. Take a look at this infographic, which explains what you should know about interest rate fluctuations before you get a mortgage.
Cooking Oils Guide
This infographic highlights some really interesting information about various types of cooking oils. It also gives some tips on how to store different type of cooking oils, their classification as well as their benefits.
Naturally Beautiful Skincare
We all want beautiful skin. But we may not be paying attention to the nasty chemicals lurking in so many skincare products. This visual guide to beautiful skin details the products to avoid (and why they’re dangerous), as well as natural alternatives. It also suggests homemade fixes for whitening teeth, preventing and softening wrinkles, and getting strong and healthy hair.
How Much Do Pets Sleep?
We all hear about the “magic eight hours” that humans should get, but how much does everyone, and everything, really sleep? Here, this infographic takes a look at dogs, cats, rabbits, birds, fish, hamsters and humans and compares the sleeping patterns.
Reactive Attachment Disorder
Reactive attachment disorder is a serious condition that some children and teens must live with. Finding ways to work with this disorder can help teens become very successful adults. Enjoy this infographic that explains how parents can make a difference in the lives of their children.
China Travel Guide
In many ways China is the “Poster Child” of Asia. Steeped in history, with more than 5,000 years of it, rooted in tradition, and rapidly globalizing, few countries in Asia, or the world, are as dynamic as China. While it would be nearly impossible to create a comprehensive list of things you need to know or will invariably learn on your own while planning your first tour to China, this infographic cuts through the haze to inform perspective travelers of the basics they’ll need to know to get their travel planning off on proper footing.
The Ultimate SEO Checklist
Doing SEO is a lot of work. Fortunately, this infographic from Leapfroggr simplifies at least one part of it by giving you a comprehensive checklist of everything you need to do to promote your site or brand online.
Become a Disney Princess With Your Makeup Kit
If you’ve ever wished upon a star that you could look like your favorite fairy tale princess, you’re not alone. Just follow some simple makeup and styling steps to capture the essence of your favorite heroine, using the easy tips in this infographic from Ogle School.
America’s Population Explosion: Where Are We Packing It Up And Packing It In?
Check out America’s fastest growing metropolitan areas in this infographic from Sparefoot. You might be surprised which cities are experiencing the most growth!
Anatomy of a Volleyball Player
Volleyball plays often come down to split-second reactions. Wearing the right gear can be the difference between a victory and defeat. Avoid injury and dominate the competition with this volleyball gear buying guide. Refer to the following infographic to learn more about the most common protective gear for those injuries that are prevalent on the gym floor.
Partners


Browse Archives By Category
Animated Infographics
Business Infographics
Career & Jobs Infographics
Education Infographics
Entertainment Industry Infographics
Environmental Infographics
Finance & Money Infographics
Food & Drink Infographics
Health Infographics
Historical Infographics
Home & Garden Infographics
Internet Infographics
Law and Legal Infographics
Lifestyle Infographics
Marketing Infographics
Offbeat Infographics
Parenting Infographics
Pets & Animals Infographics
Political Infographics
Shopping Infographics
Sports and Athletic Infographics
Technology Infographics
Transportation Infographics
Travel Infographics
Video Infographics