


Search 12,100+ Infographics!
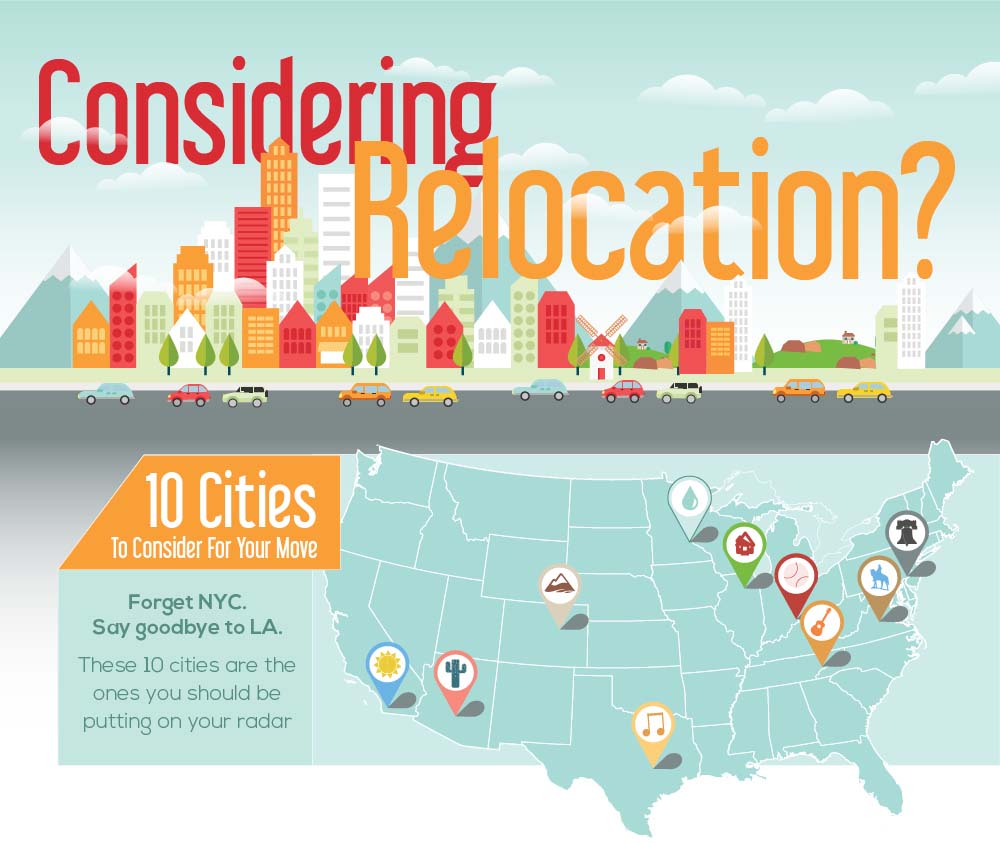
Considering Relocation – Cities to Consider for Your Next Move
Before you relocate, you need to do some research on the city of your choice. Moving to a new city can be a big decision. Does the city have a good music scene? Is it dog-friendly? How is the weather? This infographic maps out 10 of the best cities in the United States and their perks.
Understanding the Millennium Traveler
As Millennials, we want more comfort, convenience, tech amenities, and want to save money at the same time. By surveying over 1,400 participants, Hipmunk shows in this infographic what this age group craves when it comes to traveling.

The Evolution of the Modern Day Classroom
There was a time in the not-too-distant past when young people completed high school, moved swiftly into a job or trade apprenticeship, started a family, or – entered a four-year traditional university to work toward their college degree. Enter the modern age, where higher education has received a much needed facelift. This infographic shows just how prevalent the benefits of an online education are.
A World Without Morphine: Pain Around the World
Pain is a feeling that no one wants to feel for a second longer than they need to. Fortunately, there are various pain medications that help us with easing our suffering. Check out this infographic to find out in which countries is not that easy to get rid of a toothache, let alone more serious pain.
Health Checks for Women Over 50
This infographic answers the ‘what, who and how often’ health questions that many women over 50 may not know the answers to and includes information on screenings, immunization and general health information.

Be Prepared or Get Penalized HIPAA Violation: An Expensive Deal
What will HIPAA Violation cost you? If you believe; not much, you are perhaps making a blunder. Read on to know more about HIPAA violations and penalties in this infographic.
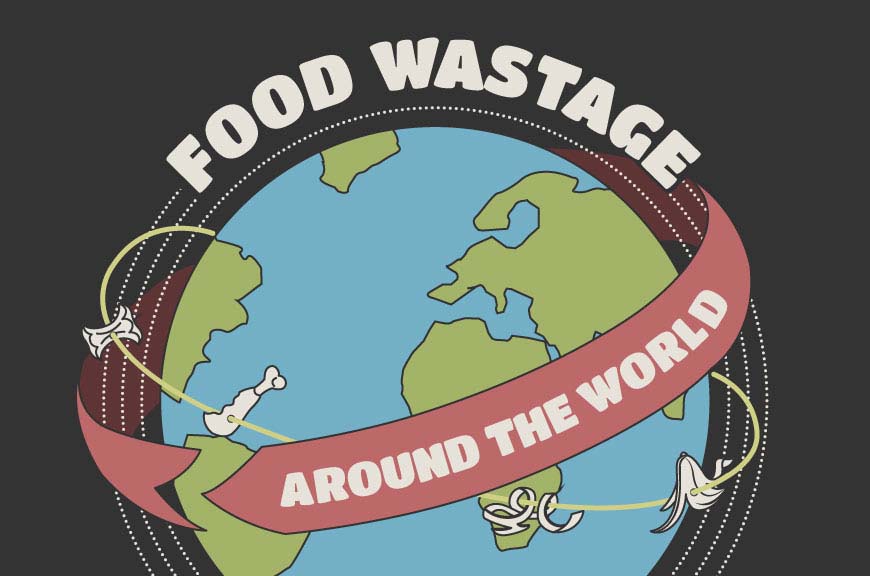
Food Wastage Around The World
Food wastage is a huge problem around the world, and it’s estimated that 30-50% of all food produced is wasted. This infographic highlights just how much of a problem it is and looks at some of the ways we can do our bit to combat the problem.
Copa America 2015 – Team Captains
You might have heard or seen some of these athletes on the headlines of soccer articles or in your newsfeed with videos of their natural talents. But here is what you might not know about these 12 international soccer players representing their countries at one of the most anticipated professional soccer tournament after the World Cup.
Ten Things to Try Before Leaving Madrid
Madrid is a city that has many sights that you cannot afford to miss. This lively city will keep you enthralled throughout your stay. Here Etihad has put together ten things to try before leaving Madrid if you want to carry home everlasting memories.
The Evolution of Infographics
The history of data and information visualization is both rich and fascinating. We have been trying to pass on our stories in a visual form since the first cave people learned how to draw on the walls of their humble homes. Learn more about the evolution of infographics in this infographic.
Considering Relocation – Cities to Consider for Your Next Move
Before you relocate, you need to do some research on the city of your choice. Moving to a new city can be a big decision. Does the city have a good music scene? Is it dog-friendly? How is the weather? This infographic maps out 10 of the best cities in the United States and their perks.
Understanding the Millennium Traveler
As Millennials, we want more comfort, convenience, tech amenities, and want to save money at the same time. By surveying over 1,400 participants, Hipmunk shows in this infographic what this age group craves when it comes to traveling.
The Evolution of the Modern Day Classroom
There was a time in the not-too-distant past when young people completed high school, moved swiftly into a job or trade apprenticeship, started a family, or – entered a four-year traditional university to work toward their college degree. Enter the modern age, where higher education has received a much needed facelift. This infographic shows just how prevalent the benefits of an online education are.
A World Without Morphine: Pain Around the World
Pain is a feeling that no one wants to feel for a second longer than they need to. Fortunately, there are various pain medications that help us with easing our suffering. Check out this infographic to find out in which countries is not that easy to get rid of a toothache, let alone more serious pain.
Health Checks for Women Over 50
This infographic answers the ‘what, who and how often’ health questions that many women over 50 may not know the answers to and includes information on screenings, immunization and general health information.
Be Prepared or Get Penalized HIPAA Violation: An Expensive Deal
What will HIPAA Violation cost you? If you believe; not much, you are perhaps making a blunder. Read on to know more about HIPAA violations and penalties in this infographic.
Food Wastage Around The World
Food wastage is a huge problem around the world, and it’s estimated that 30-50% of all food produced is wasted. This infographic highlights just how much of a problem it is and looks at some of the ways we can do our bit to combat the problem.
Copa America 2015 – Team Captains
You might have heard or seen some of these athletes on the headlines of soccer articles or in your newsfeed with videos of their natural talents. But here is what you might not know about these 12 international soccer players representing their countries at one of the most anticipated professional soccer tournament after the World Cup.
Ten Things to Try Before Leaving Madrid
Madrid is a city that has many sights that you cannot afford to miss. This lively city will keep you enthralled throughout your stay. Here Etihad has put together ten things to try before leaving Madrid if you want to carry home everlasting memories.
The Evolution of Infographics
The history of data and information visualization is both rich and fascinating. We have been trying to pass on our stories in a visual form since the first cave people learned how to draw on the walls of their humble homes. Learn more about the evolution of infographics in this infographic.
Partners


Browse Archives By Category
Animated Infographics
Business Infographics
Career & Jobs Infographics
Education Infographics
Entertainment Industry Infographics
Environmental Infographics
Finance & Money Infographics
Food & Drink Infographics
Health Infographics
Historical Infographics
Home & Garden Infographics
Internet Infographics
Law and Legal Infographics
Lifestyle Infographics
Marketing Infographics
Offbeat Infographics
Parenting Infographics
Pets & Animals Infographics
Political Infographics
Shopping Infographics
Sports and Athletic Infographics
Technology Infographics
Transportation Infographics
Travel Infographics
Video Infographics