


Search 12,100+ Infographics!
Benchmarking Enterprise B2B Demand Generation
B2B Enterprise Marketers are a unique group, with specific challenges, goals, tactics, metrics and strategies. This ANNUITAS study uncovers what drives Enterprise Marketers, their biggest challenges, how they measure success and the strategies and tactics they use to drive revenue.
Packaging Waste in the UK
As a country, the UK is gradually working at cutting down their annual waste figures. Here are just a few of the facts and figures surrounding packaging waste in the UK, laid out for you in the following infographic.
BYOD and Small Business
This infographic from ERS Computer Solutions is based around BYOD (Bring Your Own Devices), an area that small businesses need to be especially mindful of.
Car Maintenance Calendar
This infographic from First Aid Wheels aims to inform people about when they need to think about addressing various items of car maintenance.

Psychology of the Office Space
From confined static cubicles to open mobile workstations and indoor football fields. This infographic explores how the office space has been continuously changing throughout time. Productivity and an increase moral are a few of the positive outcomes of a more dynamic and creative work space.
Dorm Rooms, Garages, and Busses: Surprising Starts to Successful Startups
When you hear the words ‘successful startup’ a glorified image of a huge business may come to mind. The fact of the matter is that a large portion of the biggest companies that exist had very modest beginnings. These large scale companies may surprise you when you learn the details of where and how they began.
Marcel Breuer: Life and Selected Works
Marcel Breuer was a Hungarian-born designer, carpenter, and architect known for being a master of Modernist design. Seats and Stools has put together this infographic that covers the life and selected work of Marcel Breuer. He is most widely recognized for his design of the Breuer Chair that bears his name.

Sitcom Stars in Retirement: Del Boy Trotter
To draw attention to the importance of seeking professional advice to secure and maximize your retirement income, My Retirement Options has created a series of visuals combining the imagined lifestyles of some well-loved sitcom stars with real research into the cost of living in modern Britain.
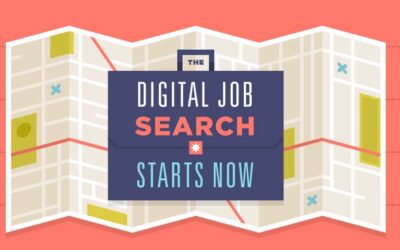
The Digital Job Search Starts Now
Job searching has changed drastically with the rise in digital job search the past decade. There is now a vast pool of online resources that anyone can use which will either make or break your job search tactics. The following infographic outlines some very helpful digital job hunt techniques and showcases useful tools that you may not have realized are at your disposal.
7 European Cities to Enjoy in the Snow
You should definitely consider visiting Europe in the winter time if you are planning your vacation. In Europe you could find a perfect destination for every traveler. In this great infographic from Wimdu, discover seven European cities to enjoy in the snow.
Benchmarking Enterprise B2B Demand Generation
B2B Enterprise Marketers are a unique group, with specific challenges, goals, tactics, metrics and strategies. This ANNUITAS study uncovers what drives Enterprise Marketers, their biggest challenges, how they measure success and the strategies and tactics they use to drive revenue.
Packaging Waste in the UK
As a country, the UK is gradually working at cutting down their annual waste figures. Here are just a few of the facts and figures surrounding packaging waste in the UK, laid out for you in the following infographic.
BYOD and Small Business
This infographic from ERS Computer Solutions is based around BYOD (Bring Your Own Devices), an area that small businesses need to be especially mindful of.
Car Maintenance Calendar
This infographic from First Aid Wheels aims to inform people about when they need to think about addressing various items of car maintenance.
Psychology of the Office Space
From confined static cubicles to open mobile workstations and indoor football fields. This infographic explores how the office space has been continuously changing throughout time. Productivity and an increase moral are a few of the positive outcomes of a more dynamic and creative work space.
Dorm Rooms, Garages, and Busses: Surprising Starts to Successful Startups
When you hear the words ‘successful startup’ a glorified image of a huge business may come to mind. The fact of the matter is that a large portion of the biggest companies that exist had very modest beginnings. These large scale companies may surprise you when you learn the details of where and how they began.
Marcel Breuer: Life and Selected Works
Marcel Breuer was a Hungarian-born designer, carpenter, and architect known for being a master of Modernist design. Seats and Stools has put together this infographic that covers the life and selected work of Marcel Breuer. He is most widely recognized for his design of the Breuer Chair that bears his name.
Sitcom Stars in Retirement: Del Boy Trotter
To draw attention to the importance of seeking professional advice to secure and maximize your retirement income, My Retirement Options has created a series of visuals combining the imagined lifestyles of some well-loved sitcom stars with real research into the cost of living in modern Britain.
The Digital Job Search Starts Now
Job searching has changed drastically with the rise in digital job search the past decade. There is now a vast pool of online resources that anyone can use which will either make or break your job search tactics. The following infographic outlines some very helpful digital job hunt techniques and showcases useful tools that you may not have realized are at your disposal.
7 European Cities to Enjoy in the Snow
You should definitely consider visiting Europe in the winter time if you are planning your vacation. In Europe you could find a perfect destination for every traveler. In this great infographic from Wimdu, discover seven European cities to enjoy in the snow.
Partners


Browse Archives By Category
Animated Infographics
Business Infographics
Career & Jobs Infographics
Education Infographics
Entertainment Industry Infographics
Environmental Infographics
Finance & Money Infographics
Food & Drink Infographics
Health Infographics
Historical Infographics
Home & Garden Infographics
Internet Infographics
Law and Legal Infographics
Lifestyle Infographics
Marketing Infographics
Offbeat Infographics
Parenting Infographics
Pets & Animals Infographics
Political Infographics
Shopping Infographics
Sports and Athletic Infographics
Technology Infographics
Transportation Infographics
Travel Infographics
Video Infographics