


Search 12,100+ Infographics!
Plain English: Who’s Got it Right and Who’s Got it Wrong
Plain English cuts out the jargon and enables people to understand information clearly. Some people in the public eye get it right when it comes to communicating in plain English while others get it wrong. Find out more in this insightful infographic.
Home Technology Trends For 2015 and Beyond
This infographic is about the advancements in home technology that are becoming more prevalent. From interactive cook tops, to hologram entertainment, the home of the future is fast becoming a reality. It explores some of the most cutting edge technology on the market, while also looking ahead at what the home of the future will be like.
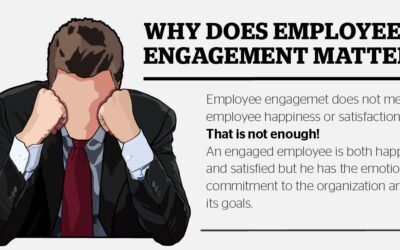
Employee Engagement and Recognition
Employee engagement is a key factor on the success of a company. It drives employees to be more productive and ultimately happier at the workplace. One of best ways to engage employees is by recognizing their efforts, but sometimes it can be tricky. Here is an infographic that explains the importance of employee engagement and why it’s essential for a great company culture and team happiness.
The Numbers Behind Dubai Fireworks 2014
Major events like Christmas and New Year are generally planned for a fantastic firework shows to entertain the crowd. At present, Dubai holds the record for the largest ever pyromusical fireworks display during the 2014 New Year event. See the numbers behind these fireworks in the following infographic.
American vs Japanese Cars: The Battle For the American Market
At present there is a fierce battle between American and Japanese car manufacturers to establish themselves as the premier car manufacturer. In 2014 it was impossible to separate them and the market was split 50/50. Moreover, the top selling cars of 2014 in America included a mix of both American & Japanese Cars. This infographic discusses American and Japanese cars from every perspective and aims to get to the bottom of which is better, if any, once and for all.
The World’s Top Ten Guard Dogs
This infographic closely examines the main characteristics of each dog breed and provides useful information about these particular canines. It provides some good knowledge about these ten breeds, their history, and what make them happy or grumpy.
Then and Now – 45 Years of Internet Access
It’s amazing to think how far the Internet has come, since its development in 1969. Following this infographic, you can track the progression of internet connectivity over the years, up to the present day. What do you think the internet has in store for us in the future?

Benefits of Setting up a Business in Singapore
Singapore has many accolades pegged to its brand, bolstering the Republic’s reputation as a key regional and global hub for companies to do business. Discover key facts and rankings about Singapore today in this infographic.

Time (On Hold) Is Money
Here is an infographic showing the cost of leaving customers on hold. It shows statistics on how long people are prepared to stay on hold, what their preferred hold options are and what the consequences can be of not meeting expectations. The graphic also highlights the importance of keeping hold of existing customers and the probability of selling to a new prospect vs an existing client.
Can You Stick To Your 2015 Fitness Resolutions?
DW Fitness Clubs asked 1000 people if they had created a fitness resolution to get fit and healthy and if they had stuck to it. They wanted to identify who made resolutions and why they faced difficulties sticking to it. This information will help people to recognize where they might fall down, and inspire them to continue with their health and fitness regimes.
Plain English: Who’s Got it Right and Who’s Got it Wrong
Plain English cuts out the jargon and enables people to understand information clearly. Some people in the public eye get it right when it comes to communicating in plain English while others get it wrong. Find out more in this insightful infographic.
Home Technology Trends For 2015 and Beyond
This infographic is about the advancements in home technology that are becoming more prevalent. From interactive cook tops, to hologram entertainment, the home of the future is fast becoming a reality. It explores some of the most cutting edge technology on the market, while also looking ahead at what the home of the future will be like.
Employee Engagement and Recognition
Employee engagement is a key factor on the success of a company. It drives employees to be more productive and ultimately happier at the workplace. One of best ways to engage employees is by recognizing their efforts, but sometimes it can be tricky. Here is an infographic that explains the importance of employee engagement and why it’s essential for a great company culture and team happiness.
The Numbers Behind Dubai Fireworks 2014
Major events like Christmas and New Year are generally planned for a fantastic firework shows to entertain the crowd. At present, Dubai holds the record for the largest ever pyromusical fireworks display during the 2014 New Year event. See the numbers behind these fireworks in the following infographic.
American vs Japanese Cars: The Battle For the American Market
At present there is a fierce battle between American and Japanese car manufacturers to establish themselves as the premier car manufacturer. In 2014 it was impossible to separate them and the market was split 50/50. Moreover, the top selling cars of 2014 in America included a mix of both American & Japanese Cars. This infographic discusses American and Japanese cars from every perspective and aims to get to the bottom of which is better, if any, once and for all.
The World’s Top Ten Guard Dogs
This infographic closely examines the main characteristics of each dog breed and provides useful information about these particular canines. It provides some good knowledge about these ten breeds, their history, and what make them happy or grumpy.
Then and Now – 45 Years of Internet Access
It’s amazing to think how far the Internet has come, since its development in 1969. Following this infographic, you can track the progression of internet connectivity over the years, up to the present day. What do you think the internet has in store for us in the future?
Benefits of Setting up a Business in Singapore
Singapore has many accolades pegged to its brand, bolstering the Republic’s reputation as a key regional and global hub for companies to do business. Discover key facts and rankings about Singapore today in this infographic.
Time (On Hold) Is Money
Here is an infographic showing the cost of leaving customers on hold. It shows statistics on how long people are prepared to stay on hold, what their preferred hold options are and what the consequences can be of not meeting expectations. The graphic also highlights the importance of keeping hold of existing customers and the probability of selling to a new prospect vs an existing client.
Can You Stick To Your 2015 Fitness Resolutions?
DW Fitness Clubs asked 1000 people if they had created a fitness resolution to get fit and healthy and if they had stuck to it. They wanted to identify who made resolutions and why they faced difficulties sticking to it. This information will help people to recognize where they might fall down, and inspire them to continue with their health and fitness regimes.
Partners


Browse Archives By Category
Animated Infographics
Business Infographics
Career & Jobs Infographics
Education Infographics
Entertainment Industry Infographics
Environmental Infographics
Finance & Money Infographics
Food & Drink Infographics
Health Infographics
Historical Infographics
Home & Garden Infographics
Internet Infographics
Law and Legal Infographics
Lifestyle Infographics
Marketing Infographics
Offbeat Infographics
Parenting Infographics
Pets & Animals Infographics
Political Infographics
Shopping Infographics
Sports and Athletic Infographics
Technology Infographics
Transportation Infographics
Travel Infographics
Video Infographics