


Search 12,100+ Infographics!
Your Guide to Green DIY Cleaning Products
Did you know that the cleaning products you use can be bad news for the environment, your home and your family? By using DIY products you can avoid this and save money in the process. Anglian Home Improvements has put together the following guide to DIY green cleaning products.
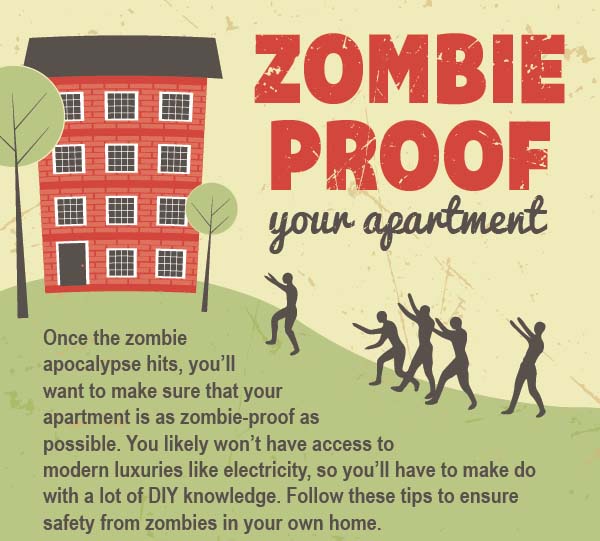
Zombie Proof Your Apartment
Attention all apartment dwellers: once a zombie apocalypse hits, you’ll want to make sure that your apartment is zombie-proof. More than likely you will not have access to modern luxuries like telephone, Internet, electricity, or other amenities. You’ll have to make do with a lot of DIY knowledge. Follow the tips outlined in this ForRent.com infographic to ensure safety from zombies in your home.
Rent Vs. Own: When To Consider
Renting a home may be preferable to buying these days, depending on your situation. Learn more about the pros and cons of renting versus buying from this infographic from Shea Homes.

How to Write an Exceptional Cover Letter
When you are sending in your resume, a question that is often asked is whether you should write a cover letter or not. You may believe that no one reads cover letters and it is just a waste of time. But this is not true. Look at this in more detail with facts gathered and analyzed in the following infographic.

Happy Birthday! Adidas Turns 65!
This infographic celebrates the 65th year of the sports apparel company Adidas. Adidas is a worldwide known brand and continues to be hugely successful.
Teen Prescription Drug Use Problems
While it’s not talked about as much as some drug problems, teen usage of prescription drugs is a problem in the United States – one that parents need to understand very clearly. The following infographic sheds some light on some of these problems.
A History of the Wedding
The Italian Villa have produced a cool infographic about The History of a Wedding. Did you know the first use of wedding bands was in 2800 BC? These and other interesting facts below.
Craft Beer Pubs of London
This infographic takes an overview of the area of craft beers in the UK and specifically highlights craft beer pubs in London where an enjoyable time can be spent tasting the relevant beers on offer. It also covers some of the ‘lingo’ or terminology used in the sector so that you are then comfortable in choosing your order and highlights some insight from industry insiders.
Anatomy of a Trade Show Model
The following infographic is designed to respond to the inquiry “what does it require to be a model?” The focus is on promotional models and findings demonstrated that these models do not differ greatly from the general population based on physical characteristics. Data was collected from over 10,000 model profiles.
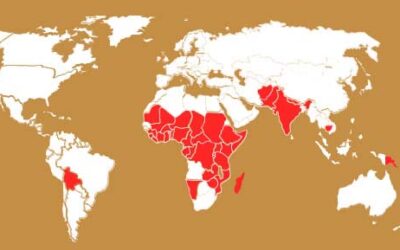
Clean Water Access In Developing Countries
This infographic presents some shocking statistics about just how far away the United Nations is from achieving their goal of 75% of the world to have access to safe drinking water by 2015. The infographic also provides an insight into the global sanitation coverage and shows how far we are behind the targets set.
Your Guide to Green DIY Cleaning Products
Did you know that the cleaning products you use can be bad news for the environment, your home and your family? By using DIY products you can avoid this and save money in the process. Anglian Home Improvements has put together the following guide to DIY green cleaning products.
Zombie Proof Your Apartment
Attention all apartment dwellers: once a zombie apocalypse hits, you’ll want to make sure that your apartment is zombie-proof. More than likely you will not have access to modern luxuries like telephone, Internet, electricity, or other amenities. You’ll have to make do with a lot of DIY knowledge. Follow the tips outlined in this ForRent.com infographic to ensure safety from zombies in your home.
Rent Vs. Own: When To Consider
Renting a home may be preferable to buying these days, depending on your situation. Learn more about the pros and cons of renting versus buying from this infographic from Shea Homes.
How to Write an Exceptional Cover Letter
When you are sending in your resume, a question that is often asked is whether you should write a cover letter or not. You may believe that no one reads cover letters and it is just a waste of time. But this is not true. Look at this in more detail with facts gathered and analyzed in the following infographic.
Happy Birthday! Adidas Turns 65!
This infographic celebrates the 65th year of the sports apparel company Adidas. Adidas is a worldwide known brand and continues to be hugely successful.
Teen Prescription Drug Use Problems
While it’s not talked about as much as some drug problems, teen usage of prescription drugs is a problem in the United States – one that parents need to understand very clearly. The following infographic sheds some light on some of these problems.
A History of the Wedding
The Italian Villa have produced a cool infographic about The History of a Wedding. Did you know the first use of wedding bands was in 2800 BC? These and other interesting facts below.
Craft Beer Pubs of London
This infographic takes an overview of the area of craft beers in the UK and specifically highlights craft beer pubs in London where an enjoyable time can be spent tasting the relevant beers on offer. It also covers some of the ‘lingo’ or terminology used in the sector so that you are then comfortable in choosing your order and highlights some insight from industry insiders.
Anatomy of a Trade Show Model
The following infographic is designed to respond to the inquiry “what does it require to be a model?” The focus is on promotional models and findings demonstrated that these models do not differ greatly from the general population based on physical characteristics. Data was collected from over 10,000 model profiles.
Clean Water Access In Developing Countries
This infographic presents some shocking statistics about just how far away the United Nations is from achieving their goal of 75% of the world to have access to safe drinking water by 2015. The infographic also provides an insight into the global sanitation coverage and shows how far we are behind the targets set.
Partners


Browse Archives By Category
Animated Infographics
Business Infographics
Career & Jobs Infographics
Education Infographics
Entertainment Industry Infographics
Environmental Infographics
Finance & Money Infographics
Food & Drink Infographics
Health Infographics
Historical Infographics
Home & Garden Infographics
Internet Infographics
Law and Legal Infographics
Lifestyle Infographics
Marketing Infographics
Offbeat Infographics
Parenting Infographics
Pets & Animals Infographics
Political Infographics
Shopping Infographics
Sports and Athletic Infographics
Technology Infographics
Transportation Infographics
Travel Infographics
Video Infographics