


Search 12,100+ Infographics!

Living Large On America’s Student Loan Debt
The total amount of federal student loans yet to be repaid is nearly $1.1 trillion. This infographic from the folks at Debt.com shows what you could buy if everyone in the nation collectively owed you $1 trillion.
The Best Apps for Older People
As we all know, there are an endless variety of apps out there for all types of activities and occasions. When it comes to the older generation, they can have different priorities in terms of what they want from technology. With this in mind, here is an infographic which details some of the best apps available for older people in terms of a number of categories e.g. health, communication, entertainment, surfing the web and more.
Which Programming Language Should I Learn First?
There is a lot of buzz around programming nowadays. If you are interested in learning coding, you should pick your first programming language to learn based on your purpose and preference. Here is a flowchart, put together by CarlCheo.Com, to help beginners to choose the best programming language to learn first easily.
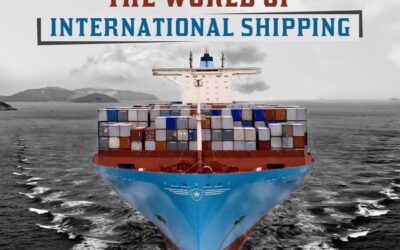
The World of International Shipping
A single container ship travels the equivalent of three-quarters of the way to the moon and back – in one year! This infographic from Bracken Foam Fabricators explores the international shipping industry, and examines how vital liner shipping is to world trade.
The Effect of Asbestos Worldwide
The amount of deaths asbestos has caused is incredible. Its use across the world has been curtailed in recent years but it is still being used in many developing countries. Thousands of people are still dying from exposure to asbestos. This infographic tells you everything you need to know about this epidemic we are still dealing with today.
Emerging Science and Technology: 2015-2013 and Beyond
Will science put an end to dementia? Is artificial intelligence in autonomous drone-drone combat possible? How about intention decoding algorithms? This timeline explores the future, looking ahead to the new technologies, big ideas and possibilities that lie downstream of breakthrough lab discoveries being made today in five science-driven areas.
The Proliferation of Mobile Apps
This infographic examines the proliferation of the mobile app industry. It looks at the demographics of mobile app usage versus the web, the analytics of time spent on apps and also at possible app growth markets.
Marie Curie
Marie Curie is a lady synonymous with the area of science and in particular cancer research. An astounding and truly inspiring lady, she would be due to turn 147 this November. Born in Poland into an unassuming family, Marie Curie was determined to have a career defined by research even at an early stage. For a woman to show such determination in terms of her career at that particular time of the century is remarkable.
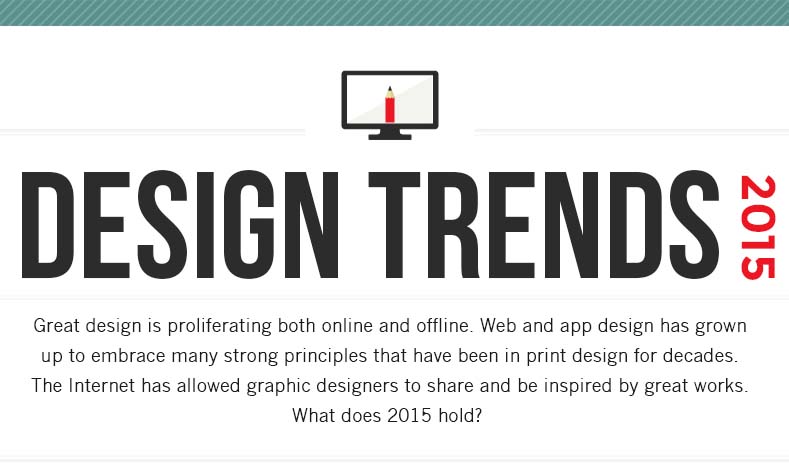
Design Trends 2015
2014 was an important year for design as we saw a big focus on quality and beauty. Images got bigger, typography got tighter, and overall everything felt more high quality. We hope to see the same again in 2015. The following infographic shows some continuing trends from 2014 as well as new trends predicted to emerge in 2015.
Top Ten Best Places to Live for Wheelchair Users
Being a wheelchair user comes with different wants and needs in terms of a place to live. This infographic highlights the ten best places to live in the United States for wheelchair users. This list is based on certain criteria that is traditionally wheelchair friendly, such as mild climates, air quality, disabled population, ease of finding resources, population of employed disabled, great public transportation, and a high level of accessibility.
Living Large On America’s Student Loan Debt
The total amount of federal student loans yet to be repaid is nearly $1.1 trillion. This infographic from the folks at Debt.com shows what you could buy if everyone in the nation collectively owed you $1 trillion.
The Best Apps for Older People
As we all know, there are an endless variety of apps out there for all types of activities and occasions. When it comes to the older generation, they can have different priorities in terms of what they want from technology. With this in mind, here is an infographic which details some of the best apps available for older people in terms of a number of categories e.g. health, communication, entertainment, surfing the web and more.
Which Programming Language Should I Learn First?
There is a lot of buzz around programming nowadays. If you are interested in learning coding, you should pick your first programming language to learn based on your purpose and preference. Here is a flowchart, put together by CarlCheo.Com, to help beginners to choose the best programming language to learn first easily.
The World of International Shipping
A single container ship travels the equivalent of three-quarters of the way to the moon and back – in one year! This infographic from Bracken Foam Fabricators explores the international shipping industry, and examines how vital liner shipping is to world trade.
The Effect of Asbestos Worldwide
The amount of deaths asbestos has caused is incredible. Its use across the world has been curtailed in recent years but it is still being used in many developing countries. Thousands of people are still dying from exposure to asbestos. This infographic tells you everything you need to know about this epidemic we are still dealing with today.
Emerging Science and Technology: 2015-2013 and Beyond
Will science put an end to dementia? Is artificial intelligence in autonomous drone-drone combat possible? How about intention decoding algorithms? This timeline explores the future, looking ahead to the new technologies, big ideas and possibilities that lie downstream of breakthrough lab discoveries being made today in five science-driven areas.
The Proliferation of Mobile Apps
This infographic examines the proliferation of the mobile app industry. It looks at the demographics of mobile app usage versus the web, the analytics of time spent on apps and also at possible app growth markets.
Marie Curie
Marie Curie is a lady synonymous with the area of science and in particular cancer research. An astounding and truly inspiring lady, she would be due to turn 147 this November. Born in Poland into an unassuming family, Marie Curie was determined to have a career defined by research even at an early stage. For a woman to show such determination in terms of her career at that particular time of the century is remarkable.
Design Trends 2015
2014 was an important year for design as we saw a big focus on quality and beauty. Images got bigger, typography got tighter, and overall everything felt more high quality. We hope to see the same again in 2015. The following infographic shows some continuing trends from 2014 as well as new trends predicted to emerge in 2015.
Top Ten Best Places to Live for Wheelchair Users
Being a wheelchair user comes with different wants and needs in terms of a place to live. This infographic highlights the ten best places to live in the United States for wheelchair users. This list is based on certain criteria that is traditionally wheelchair friendly, such as mild climates, air quality, disabled population, ease of finding resources, population of employed disabled, great public transportation, and a high level of accessibility.
Partners


Browse Archives By Category
Animated Infographics
Business Infographics
Career & Jobs Infographics
Education Infographics
Entertainment Industry Infographics
Environmental Infographics
Finance & Money Infographics
Food & Drink Infographics
Health Infographics
Historical Infographics
Home & Garden Infographics
Internet Infographics
Law and Legal Infographics
Lifestyle Infographics
Marketing Infographics
Offbeat Infographics
Parenting Infographics
Pets & Animals Infographics
Political Infographics
Shopping Infographics
Sports and Athletic Infographics
Technology Infographics
Transportation Infographics
Travel Infographics
Video Infographics