


Search 12,100+ Infographics!

FinanceU Syllabus
Here is a fun infographic for students and parents to assist with planning ahead, evaluating the total cost of a college education, and understanding the return on your investment.
5 Advertising Predictions for 2015
2015 will be a big year for advertising. In an industry that’s all about being seen and remembered in a digital environment with an increasing amount of noise, how do you avoid getting lost in the shuffle? The following infographic highlights what trends, changes, and advances are on the horizon for the industry.
Facts About The Empire State Building
In this infographic, learn all the fun and fascinating facts about the history of The Empire State Building, such as how it took 3,000 workers over the course iof just one year to build it.
The Small Business Health Economy
The Affordable Care Act has changed healthcare forever. It’s now harder than ever for small business to provide affordable health benefits for their employees. In fact, the current state of small business healthcare is bleak, but it could be better if more businesses switched to a defined contribution plan. In this infographic, learn how letting your employees choose individual healthcare will benefit them and your business at the same time.

How to Make A Room Look Bigger
Every homeowner wants more space in their home. But if you’re not lucky enough to live in a big house or airy loft with room to spare, you will have to create the illusion of space. This infographic takes the ten most important points when refitting your room for a spacious look, and breaks them down into easily-achievable tasks.
The Beauty of Custom Barn Homes
What do you get when you combine everything you seek in a home and the ultimate workspace? A barn home. Also referred to as “barndominums” or “barndos,” barn homes are hot in the custom housing market. In this infographic, you’ll see how this barn home melds the homeowner’s love for entertaining along with his love of the outdoors.

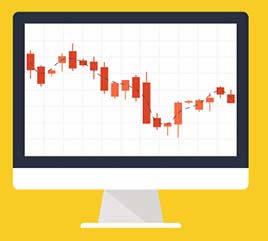
Beginner’s Guide to Binary Options Trading
The main feature of binary options is that the trader knows how much he can lose or win on any of the options before the transaction; High Profitability – you may double the amount of your investment costs in just a minute; and Simplicity – because the amount of payments for binary options depends largely on the direction of change of the price of the asset.
U.S. Transportation Innovation Means Mobile WiFi Is On the Move
In the past decade, mass transportation ridership has exploded to levels that haven’t been reached since the 1950’s. Increasing numbers of Millennials are choosing to take the train to work rather than drive, giving them an extra chunk of potentially productive time during their day. With mobile WiFi, commuters have the opportunity to utilize travel time, and 68% of riders are willing to watch ads to get it.

All You Need To Know About Self Storage
This infographic has been created with the big idea of explaining the consumer the types of storage facilities and their unit size division. This infographic will be useful for them to know the points to check in a self storage facility.
How Smart Luggage Will Change Travel
Technology is changing the way we live and also the way we travel. There has been much progress in the area of tracking your luggage, which should make life easier for all passengers. Read this infographic to learn more about this interesting topic.
FinanceU Syllabus
Here is a fun infographic for students and parents to assist with planning ahead, evaluating the total cost of a college education, and understanding the return on your investment.
5 Advertising Predictions for 2015
2015 will be a big year for advertising. In an industry that’s all about being seen and remembered in a digital environment with an increasing amount of noise, how do you avoid getting lost in the shuffle? The following infographic highlights what trends, changes, and advances are on the horizon for the industry.
Facts About The Empire State Building
In this infographic, learn all the fun and fascinating facts about the history of The Empire State Building, such as how it took 3,000 workers over the course iof just one year to build it.
The Small Business Health Economy
The Affordable Care Act has changed healthcare forever. It’s now harder than ever for small business to provide affordable health benefits for their employees. In fact, the current state of small business healthcare is bleak, but it could be better if more businesses switched to a defined contribution plan. In this infographic, learn how letting your employees choose individual healthcare will benefit them and your business at the same time.
How to Make A Room Look Bigger
Every homeowner wants more space in their home. But if you’re not lucky enough to live in a big house or airy loft with room to spare, you will have to create the illusion of space. This infographic takes the ten most important points when refitting your room for a spacious look, and breaks them down into easily-achievable tasks.
The Beauty of Custom Barn Homes
What do you get when you combine everything you seek in a home and the ultimate workspace? A barn home. Also referred to as “barndominums” or “barndos,” barn homes are hot in the custom housing market. In this infographic, you’ll see how this barn home melds the homeowner’s love for entertaining along with his love of the outdoors.
Beginner’s Guide to Binary Options Trading
The main feature of binary options is that the trader knows how much he can lose or win on any of the options before the transaction; High Profitability – you may double the amount of your investment costs in just a minute; and Simplicity – because the amount of payments for binary options depends largely on the direction of change of the price of the asset.
U.S. Transportation Innovation Means Mobile WiFi Is On the Move
In the past decade, mass transportation ridership has exploded to levels that haven’t been reached since the 1950’s. Increasing numbers of Millennials are choosing to take the train to work rather than drive, giving them an extra chunk of potentially productive time during their day. With mobile WiFi, commuters have the opportunity to utilize travel time, and 68% of riders are willing to watch ads to get it.
All You Need To Know About Self Storage
This infographic has been created with the big idea of explaining the consumer the types of storage facilities and their unit size division. This infographic will be useful for them to know the points to check in a self storage facility.
How Smart Luggage Will Change Travel
Technology is changing the way we live and also the way we travel. There has been much progress in the area of tracking your luggage, which should make life easier for all passengers. Read this infographic to learn more about this interesting topic.
Partners


Browse Archives By Category
Animated Infographics
Business Infographics
Career & Jobs Infographics
Education Infographics
Entertainment Industry Infographics
Environmental Infographics
Finance & Money Infographics
Food & Drink Infographics
Health Infographics
Historical Infographics
Home & Garden Infographics
Internet Infographics
Law and Legal Infographics
Lifestyle Infographics
Marketing Infographics
Offbeat Infographics
Parenting Infographics
Pets & Animals Infographics
Political Infographics
Shopping Infographics
Sports and Athletic Infographics
Technology Infographics
Transportation Infographics
Travel Infographics
Video Infographics