


Search 12,100+ Infographics!
Which Countries Wine Down The Most?
Wine drinking isn’t a contest, at least not a close one. In fact, wine has been a dietary staple since the beginning of recorded human history. It may not surprise you to learn that Italy, France, and Spain produce the most wine in the world, but did you know that Vatican City is the greatest consumer per capita? Check out this infographic from the folks for facts and stats about who drinks the most wine.

How Playing an Instrument Benefits Your Brain
The activity of playing an instrument becomes more like a full-body brain workout! What’s going on? Anita Collins explains the fireworks that go off in musicians’ brains when they play and examines some of the long-term positive effects of this mental workout

Green Ways to Keep Pests From Your Home
Don’t risk the health of your family by using repellents that can be harmful for them. Find out green ways to keep pests out of your home. Get some great and innovative advices in this helpful infographic.
How Furnace Tune Ups Save You Money
Do you really save money on fuel when you get yearly maintenance on your furnace? This infographic from Husky Heating and Air Conditioning does the math and comes up with a real dollars and cents answer. It also shows you additional ways to save on heating costs.
UnZip the Power of Real Spying – NSA vs Spy Apps
It’s intriguing to compare NSA’s spying with that of the spy apps. The intentions of the two spying mechanisms are completely contradictory. While the government organization might claim to be monitoring us to ensure our own safety and to monitor the ever escalating crime rate, the facts are still quite shocking. This infographic juxtaposes NSA’s monitoring activity with that of the spy apps
What Type Of Driver Are You?
We experience all types of drivers everyday, the stereotypes ranging from the boy racer with grand theft auto style racing flames, the frankly boring and safe ‘midlife man’or the ‘chelsea mummy’ tooting in the 4×4. Do you recognize any of these characters? Which of them drive you crazy? And most importantly, which cars suit your personality?
History of The Minimum Wage In The United States
Under the Fair Labor Standards Act (FLSA), workers in the United States must be paid at least a minimum wage — currently set at $7.25 an hour. But how did we get to today’s rate of $7.25 an hour? Here is an infographic from HRDirect that takes a closer look at the history of the minimum wage.
Apocalypse Survival Tips: Life Without the SEC
Ever find yourself in this predicament? Being deprived of your school’s team can be an ugly thing and it’s no wonder how desperate things can get on game-day. With college football season upon us, get the SEC Network from Dish and you save yourself from the oncoming effects of SEC deprivation.
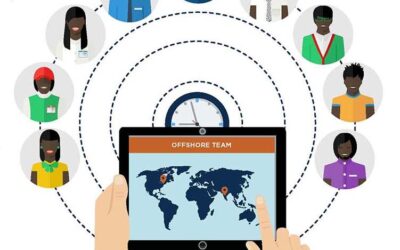
Nearshore Outsourcing 101: Better Option for North American Organizations
Here is an easy to understand, colorful, educational publication to inspire tech and business communities at large and SM followers by providing information about the growing advantages of nearshoring outsourcing for North American organizations.
Second-hand Cars in the UK – Things You Auto-Know
Second-hand car sales were up in 2013 in the United kingdom. This infographic from Gumtree has been compiled to present the statistics and facts of the buying public. For example the most expensive car listing in 2013 was an Aston Martin Vanquish.Learn more below.
Which Countries Wine Down The Most?
Wine drinking isn’t a contest, at least not a close one. In fact, wine has been a dietary staple since the beginning of recorded human history. It may not surprise you to learn that Italy, France, and Spain produce the most wine in the world, but did you know that Vatican City is the greatest consumer per capita? Check out this infographic from the folks for facts and stats about who drinks the most wine.
How Playing an Instrument Benefits Your Brain
The activity of playing an instrument becomes more like a full-body brain workout! What’s going on? Anita Collins explains the fireworks that go off in musicians’ brains when they play and examines some of the long-term positive effects of this mental workout
Green Ways to Keep Pests From Your Home
Don’t risk the health of your family by using repellents that can be harmful for them. Find out green ways to keep pests out of your home. Get some great and innovative advices in this helpful infographic.
How Furnace Tune Ups Save You Money
Do you really save money on fuel when you get yearly maintenance on your furnace? This infographic from Husky Heating and Air Conditioning does the math and comes up with a real dollars and cents answer. It also shows you additional ways to save on heating costs.
UnZip the Power of Real Spying – NSA vs Spy Apps
It’s intriguing to compare NSA’s spying with that of the spy apps. The intentions of the two spying mechanisms are completely contradictory. While the government organization might claim to be monitoring us to ensure our own safety and to monitor the ever escalating crime rate, the facts are still quite shocking. This infographic juxtaposes NSA’s monitoring activity with that of the spy apps
What Type Of Driver Are You?
We experience all types of drivers everyday, the stereotypes ranging from the boy racer with grand theft auto style racing flames, the frankly boring and safe ‘midlife man’or the ‘chelsea mummy’ tooting in the 4×4. Do you recognize any of these characters? Which of them drive you crazy? And most importantly, which cars suit your personality?
History of The Minimum Wage In The United States
Under the Fair Labor Standards Act (FLSA), workers in the United States must be paid at least a minimum wage — currently set at $7.25 an hour. But how did we get to today’s rate of $7.25 an hour? Here is an infographic from HRDirect that takes a closer look at the history of the minimum wage.
Apocalypse Survival Tips: Life Without the SEC
Ever find yourself in this predicament? Being deprived of your school’s team can be an ugly thing and it’s no wonder how desperate things can get on game-day. With college football season upon us, get the SEC Network from Dish and you save yourself from the oncoming effects of SEC deprivation.
Nearshore Outsourcing 101: Better Option for North American Organizations
Here is an easy to understand, colorful, educational publication to inspire tech and business communities at large and SM followers by providing information about the growing advantages of nearshoring outsourcing for North American organizations.
Second-hand Cars in the UK – Things You Auto-Know
Second-hand car sales were up in 2013 in the United kingdom. This infographic from Gumtree has been compiled to present the statistics and facts of the buying public. For example the most expensive car listing in 2013 was an Aston Martin Vanquish.Learn more below.
Partners


Browse Archives By Category
Animated Infographics
Business Infographics
Career & Jobs Infographics
Education Infographics
Entertainment Industry Infographics
Environmental Infographics
Finance & Money Infographics
Food & Drink Infographics
Health Infographics
Historical Infographics
Home & Garden Infographics
Internet Infographics
Law and Legal Infographics
Lifestyle Infographics
Marketing Infographics
Offbeat Infographics
Parenting Infographics
Pets & Animals Infographics
Political Infographics
Shopping Infographics
Sports and Athletic Infographics
Technology Infographics
Transportation Infographics
Travel Infographics
Video Infographics