


Search 12,100+ Infographics!
The Road To Successful Panda Recovery
Google’s Panda algorithm updates can have a negative impact on web sites that have low quality content and usability issues. Want to avoid being on the victim side of the next Panda update? Or maybe you already are an unfortunate victim of a Panda update? Check out the following infographic which provides a step-by-step process on how to recover from a Panda penalty.
Vegan & Gluten Free Baking Alternatives
When you suffer from a gluten allergy or you are a vegan, food becomes an important focus in your life. This is due to the fact that you have to be careful what you eat because you might become very ill or it might go against your moral views on animal welfare. The following infographic shows the types of ingredient alternatives that can be used in cakes, cupcakes and buns.
The Rise Of Digital vs. The Vinyl Revival
The unexpected sales success of music formatting last year has been labelled ‘The Vinyl Revival’. The following infographic delves into how and why the cult following for vinyl has resurfaced in this booming digital age. Alongside this, they’ll question the popularity of digital and what this could mean for the music industry.
The Leaning Tower of Pisa Facts
Did you know that there are some famous buildings that also lean, some even more than the Tower in Pisa? Learn about 7 bells that represents one note of the musical major scale in the Leaning Tower of Pisa, and see at what angle does the Leaning Tower of Pisa lean. There are dozens of interesting facts about the Leaning Tower of Pisa, and this infographic visualizes the most interesting ones.
The Impact of Negative Social Media and Your Employer Brand
With the number one external source of hire coming from employee referrals, negative social media and online reviews can do great damage to your employer brand. This infographic sheds light on earning positive word of mouth from your employees.
What is the Best Way to Build a Website?
While there are many different methods used to build a website, there’s only one best way to do so: the smart way. This involves finding just the right platform and tools with which to build a website, whether you use WordPress, hire a professional, or use an online website builder. The cost will vary depending upon the method you employ, and so will the time.
History of the Internet of Things
This infographic deals with emergence of Internet and the usage of it in day today life. It comprises of history of browser usage and the working procedure.
8 Ways Your Car Can Already Drive Itself
Are you prepared for driverless cars? The future is not that far away. In this interesting infographic, you will see some great examples of autonomous technology.

Secrets to a Killer Viral Video
Want your video to be seen by the world? You’re not the only one. “Virality” is a new marketing buzz phrase which seems to be the number one goal of everyone with a webcam. You can prime your video to go viral by following the steps detailed in the following infographic. From what content to include, to the perfect time to release your video, to exactly where and how to promote it, the infographic serves as an all-inclusive guide to getting your video to go viral.
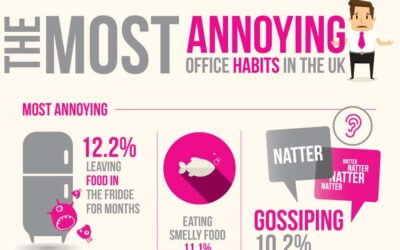
The UK’s Most Annoying Office Habits
It can be hard enough getting out of bed each and every morning to go to work, without your colleagues causing you even more issues with their annoying habits. The last thing you want when you’re having a had day is to have to deal with irritation. Paperstone surveyed UK office workers to figure out which things people hate most.
The Road To Successful Panda Recovery
Google’s Panda algorithm updates can have a negative impact on web sites that have low quality content and usability issues. Want to avoid being on the victim side of the next Panda update? Or maybe you already are an unfortunate victim of a Panda update? Check out the following infographic which provides a step-by-step process on how to recover from a Panda penalty.
Vegan & Gluten Free Baking Alternatives
When you suffer from a gluten allergy or you are a vegan, food becomes an important focus in your life. This is due to the fact that you have to be careful what you eat because you might become very ill or it might go against your moral views on animal welfare. The following infographic shows the types of ingredient alternatives that can be used in cakes, cupcakes and buns.
The Rise Of Digital vs. The Vinyl Revival
The unexpected sales success of music formatting last year has been labelled ‘The Vinyl Revival’. The following infographic delves into how and why the cult following for vinyl has resurfaced in this booming digital age. Alongside this, they’ll question the popularity of digital and what this could mean for the music industry.
The Leaning Tower of Pisa Facts
Did you know that there are some famous buildings that also lean, some even more than the Tower in Pisa? Learn about 7 bells that represents one note of the musical major scale in the Leaning Tower of Pisa, and see at what angle does the Leaning Tower of Pisa lean. There are dozens of interesting facts about the Leaning Tower of Pisa, and this infographic visualizes the most interesting ones.
The Impact of Negative Social Media and Your Employer Brand
With the number one external source of hire coming from employee referrals, negative social media and online reviews can do great damage to your employer brand. This infographic sheds light on earning positive word of mouth from your employees.
What is the Best Way to Build a Website?
While there are many different methods used to build a website, there’s only one best way to do so: the smart way. This involves finding just the right platform and tools with which to build a website, whether you use WordPress, hire a professional, or use an online website builder. The cost will vary depending upon the method you employ, and so will the time.
History of the Internet of Things
This infographic deals with emergence of Internet and the usage of it in day today life. It comprises of history of browser usage and the working procedure.
8 Ways Your Car Can Already Drive Itself
Are you prepared for driverless cars? The future is not that far away. In this interesting infographic, you will see some great examples of autonomous technology.
Secrets to a Killer Viral Video
Want your video to be seen by the world? You’re not the only one. “Virality” is a new marketing buzz phrase which seems to be the number one goal of everyone with a webcam. You can prime your video to go viral by following the steps detailed in the following infographic. From what content to include, to the perfect time to release your video, to exactly where and how to promote it, the infographic serves as an all-inclusive guide to getting your video to go viral.
The UK’s Most Annoying Office Habits
It can be hard enough getting out of bed each and every morning to go to work, without your colleagues causing you even more issues with their annoying habits. The last thing you want when you’re having a had day is to have to deal with irritation. Paperstone surveyed UK office workers to figure out which things people hate most.
Partners


Browse Archives By Category
Animated Infographics
Business Infographics
Career & Jobs Infographics
Education Infographics
Entertainment Industry Infographics
Environmental Infographics
Finance & Money Infographics
Food & Drink Infographics
Health Infographics
Historical Infographics
Home & Garden Infographics
Internet Infographics
Law and Legal Infographics
Lifestyle Infographics
Marketing Infographics
Offbeat Infographics
Parenting Infographics
Pets & Animals Infographics
Political Infographics
Shopping Infographics
Sports and Athletic Infographics
Technology Infographics
Transportation Infographics
Travel Infographics
Video Infographics