


Search 12,100+ Infographics!
Parenting Gems from the Kingdom of Fiction
This infographic features beloved parental characters from TV, movies, and literature. Parents are bombarded with opinions on how to properly raise children which can come from books, experts, family, friends, teachers, and blogs. It can be overwhelming to decide what to believe. So why not “make believe”?
12 Things You Need to Know to Become a Smart Diamond Shopper
When it comes to buying a diamond, first timers often find the experience to be intimidating and confusing. The fact is though that beautiful (and affordable) diamonds can be found in almost any kind of budget. You just need to know how to shop smartly in order to get better value for your money.

8 of the Best Big-City Oktoberfests In The U.S.
Oktoberfest is a big deal to lots of people across America. Learn which cities have the best celebrations in this infographic which was created by The Sparefoot Blog.
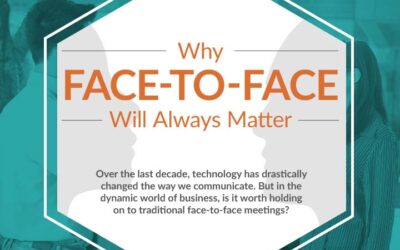
Why Face-To-Face Will Always Matter
Did you know your clients will rather choose face to face meeting than a call? Face to face meetings will always be better that emails or phone calls. Find out why in this infographic from CT Business Travel.
The Dangers of Truck Accidents
This infographic from Gary A. Peterson highlights how many trucks and other vehicles are involved in fatal accidents each year, as well as how many pedestrians and cyclists are killed as a result. Also included is the total number of fatal truck accidents in the U.S. between 2004 and 2008—and the number is a staggering one.
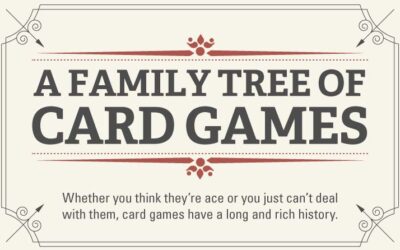
A Family Tree of Card Games
Everywhere around the world card games are used to help fill the time. Surely you have also enjoyed playing card games. Find out some interesting facts about the rich history of card games in this infographic.
How Your Brain Sees a Logo
This infographic takes a closer look at the brain science behind how we see and make sense of the logos and brands we encounter every day. From seeing color and shape, then adding meaning from past experience—the whole process amazingly takes less than 400 milliseconds. Then things get interesting. The logo design can actually change human behavior.
The Do’s and Don’ts of Being a Recovery Ally
Addiction recovery is a community effort. It takes all kinds of people, working together, to beat addiction. For our loved ones who are suffering from substance abuse, but who want to get help, we can lift them up by being good recovery allies.
Creating Confident Kids
Parenting can be tricky business. Everyone knows it but no one truly knows how much until they become a parent themselves. One thing many parents struggle with is creating confident kids. A confident kid will grow up to have the greatest possible chance to have success in life.
It’s Time To Embrace Cloud Security
Cloud security is pretty important for your business these days. Learn about the various options available to you in this infographic.
Parenting Gems from the Kingdom of Fiction
This infographic features beloved parental characters from TV, movies, and literature. Parents are bombarded with opinions on how to properly raise children which can come from books, experts, family, friends, teachers, and blogs. It can be overwhelming to decide what to believe. So why not “make believe”?
12 Things You Need to Know to Become a Smart Diamond Shopper
When it comes to buying a diamond, first timers often find the experience to be intimidating and confusing. The fact is though that beautiful (and affordable) diamonds can be found in almost any kind of budget. You just need to know how to shop smartly in order to get better value for your money.
8 of the Best Big-City Oktoberfests In The U.S.
Oktoberfest is a big deal to lots of people across America. Learn which cities have the best celebrations in this infographic which was created by The Sparefoot Blog.
Why Face-To-Face Will Always Matter
Did you know your clients will rather choose face to face meeting than a call? Face to face meetings will always be better that emails or phone calls. Find out why in this infographic from CT Business Travel.
The Dangers of Truck Accidents
This infographic from Gary A. Peterson highlights how many trucks and other vehicles are involved in fatal accidents each year, as well as how many pedestrians and cyclists are killed as a result. Also included is the total number of fatal truck accidents in the U.S. between 2004 and 2008—and the number is a staggering one.
A Family Tree of Card Games
Everywhere around the world card games are used to help fill the time. Surely you have also enjoyed playing card games. Find out some interesting facts about the rich history of card games in this infographic.
How Your Brain Sees a Logo
This infographic takes a closer look at the brain science behind how we see and make sense of the logos and brands we encounter every day. From seeing color and shape, then adding meaning from past experience—the whole process amazingly takes less than 400 milliseconds. Then things get interesting. The logo design can actually change human behavior.
The Do’s and Don’ts of Being a Recovery Ally
Addiction recovery is a community effort. It takes all kinds of people, working together, to beat addiction. For our loved ones who are suffering from substance abuse, but who want to get help, we can lift them up by being good recovery allies.
Creating Confident Kids
Parenting can be tricky business. Everyone knows it but no one truly knows how much until they become a parent themselves. One thing many parents struggle with is creating confident kids. A confident kid will grow up to have the greatest possible chance to have success in life.
It’s Time To Embrace Cloud Security
Cloud security is pretty important for your business these days. Learn about the various options available to you in this infographic.
Partners


Browse Archives By Category
Animated Infographics
Business Infographics
Career & Jobs Infographics
Education Infographics
Entertainment Industry Infographics
Environmental Infographics
Finance & Money Infographics
Food & Drink Infographics
Health Infographics
Historical Infographics
Home & Garden Infographics
Internet Infographics
Law and Legal Infographics
Lifestyle Infographics
Marketing Infographics
Offbeat Infographics
Parenting Infographics
Pets & Animals Infographics
Political Infographics
Shopping Infographics
Sports and Athletic Infographics
Technology Infographics
Transportation Infographics
Travel Infographics
Video Infographics