


Search 12,100+ Infographics!
How Much Money Will Autonomous Cars Ultimately Save?
We live in a world where the real possibility exists that our cars no longer have drivers. This infographic shows how this is possible with autonomous cars and how much money they can ultimately save.

DAM It’s About Saving Your Assets
Digital asset management (DAM) can save your business money. Check out this infographic by DAM Learning Center to find out how much time and money effective DAM can save you. DAM systems can lead to a highly positive return on investment (ROI) for many teams.
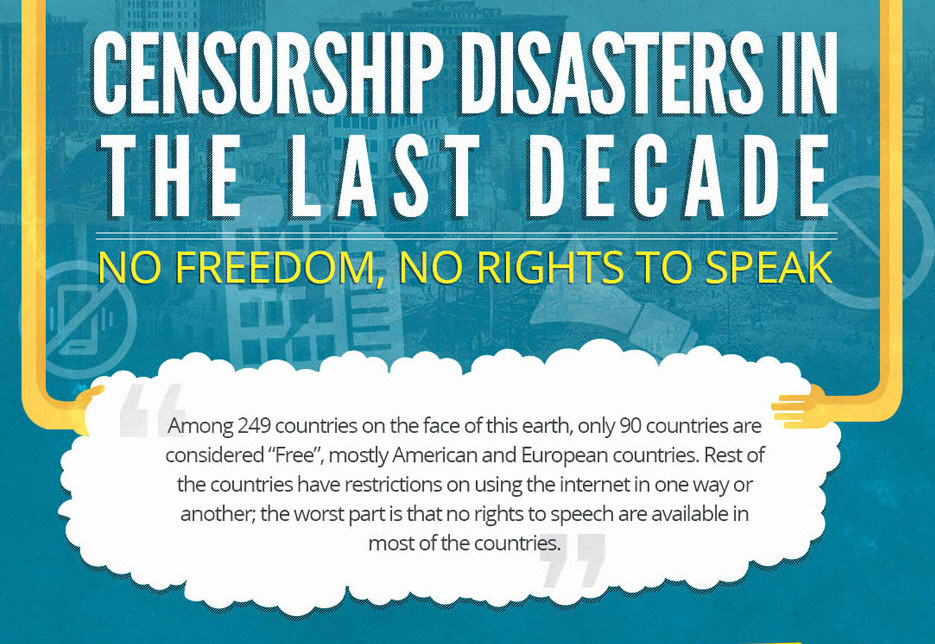
Censorship Disasters in the Last Decade
Using research reports by “Reporters without Borders” and Freedom House 2013 “Freedom On The Net,” PureVPN has compiled an infographic on Internet censorship around the world, including worst censorship disasters of the last decades, worst censored countries and more.

Thirteen Banned and Challenged Books
Here is an infographic providing information on thirteen different books that have been banned between 2000-2009 and the reasons why they were banned.
Evolution of the Bathroom
Here is an infographic showing the evolution of the modern bathroom over the years. It looks at walk-in baths, walk-in showers and more.

Robin Williams: The Man Who Made the World Laugh
Mammoth Infographics has put together the following visual representation which serves as a tribute to Robin Williams, chronicling his life and achievements.
13 Signs Of Baby Teething Along With Remedies
Baby teething is another milestone in your baby which you eagerly wait for. Knowing the symptoms is important as a parent. Here is an infographic from Mom Junction that will help you to know the signs and the remedies to abate the severe symptoms.

Tips for Online Students Working In Virtual Groups
Drexel University has created a resource for online learners to help students work successfully in virtual groups. While working in groups can be tough online, these helpful suggestions can ease the process. The tips in this infographic can benefit students currently enrolled in an online program as well as those considering going back to school online.
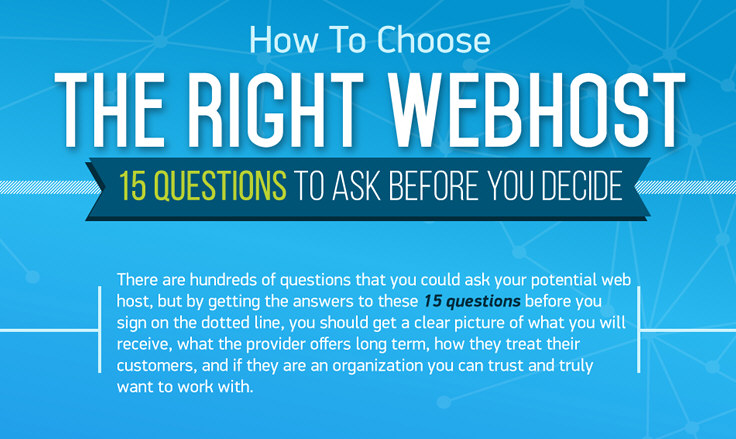
How To Choose the Right Web Host
There are literally thousands of web hosting providers out there to choose from – but finding the providers and then researching and qualifying them all is inundating and, frankly, overwhelming. And, after all of that’s done, you want to know that you are with the right host for your company because, while you can switch, life is much easier if you don’t have to.
What if Everyone Swapped Their Cars for Bicycles?
A world without cars would certainly change the way we get from one place to another, but how exactly would it change things in regards to cycling? Take a look in this infographic from Pound Place to see what might happen if everyone swapped cars for bicycles.
How Much Money Will Autonomous Cars Ultimately Save?
We live in a world where the real possibility exists that our cars no longer have drivers. This infographic shows how this is possible with autonomous cars and how much money they can ultimately save.
DAM It’s About Saving Your Assets
Digital asset management (DAM) can save your business money. Check out this infographic by DAM Learning Center to find out how much time and money effective DAM can save you. DAM systems can lead to a highly positive return on investment (ROI) for many teams.
Censorship Disasters in the Last Decade
Using research reports by “Reporters without Borders” and Freedom House 2013 “Freedom On The Net,” PureVPN has compiled an infographic on Internet censorship around the world, including worst censorship disasters of the last decades, worst censored countries and more.
Thirteen Banned and Challenged Books
Here is an infographic providing information on thirteen different books that have been banned between 2000-2009 and the reasons why they were banned.
Evolution of the Bathroom
Here is an infographic showing the evolution of the modern bathroom over the years. It looks at walk-in baths, walk-in showers and more.
Robin Williams: The Man Who Made the World Laugh
Mammoth Infographics has put together the following visual representation which serves as a tribute to Robin Williams, chronicling his life and achievements.
13 Signs Of Baby Teething Along With Remedies
Baby teething is another milestone in your baby which you eagerly wait for. Knowing the symptoms is important as a parent. Here is an infographic from Mom Junction that will help you to know the signs and the remedies to abate the severe symptoms.
Tips for Online Students Working In Virtual Groups
Drexel University has created a resource for online learners to help students work successfully in virtual groups. While working in groups can be tough online, these helpful suggestions can ease the process. The tips in this infographic can benefit students currently enrolled in an online program as well as those considering going back to school online.
How To Choose the Right Web Host
There are literally thousands of web hosting providers out there to choose from – but finding the providers and then researching and qualifying them all is inundating and, frankly, overwhelming. And, after all of that’s done, you want to know that you are with the right host for your company because, while you can switch, life is much easier if you don’t have to.
What if Everyone Swapped Their Cars for Bicycles?
A world without cars would certainly change the way we get from one place to another, but how exactly would it change things in regards to cycling? Take a look in this infographic from Pound Place to see what might happen if everyone swapped cars for bicycles.
Partners


Browse Archives By Category
Animated Infographics
Business Infographics
Career & Jobs Infographics
Education Infographics
Entertainment Industry Infographics
Environmental Infographics
Finance & Money Infographics
Food & Drink Infographics
Health Infographics
Historical Infographics
Home & Garden Infographics
Internet Infographics
Law and Legal Infographics
Lifestyle Infographics
Marketing Infographics
Offbeat Infographics
Parenting Infographics
Pets & Animals Infographics
Political Infographics
Shopping Infographics
Sports and Athletic Infographics
Technology Infographics
Transportation Infographics
Travel Infographics
Video Infographics