


Search 12,100+ Infographics!
The Filthiest Tourist Attractions on the Planet
Want to know where some of the dirtiest, germiest and grimiest popular tourist spots around the world are? Hassle.com have put together this list including the likes of the Blarney Stone in Ireland, Seattle’s famous ‘Gum Wall’ and the creepy ‘Island of the Dolls’ in Mexico.
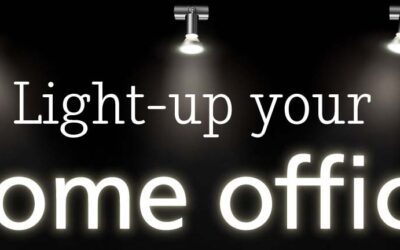
Light Up Your Home Office
Your home office should be properly and evenly lit with indirect lighting. It is recommended that you avoid overhead lighting where possible. Your office space should be lit so that there is no shadow or dead zones. This infographic from Beautiful Things Lighting aims at helping individuals understand the importance of using appropriate lighting in an office.
The Power of Smiling
Everyone loves to smile. Or, at least, everyone should! However, smiling isn’t just an expression of joy – it’s also a cognitive reflex to positive aspects of life that release endorphins, dopamine and serotonin – making you feel physically better. Happiness makes you smile, and smiling makes you happier – it’s a positive feedback loop that just keeps on giving.

Six Productivity Hacks Backed By Science
If you are looking for some creative productivity hacks, one which are backed by science, CourseFinder has put together some fantastic tips for you in this infographic.

How To Secure Funding for Your Startup
Anyone hoping to enter the entrepreneurial arena needs to first calculate how much cash they’ll need on hand, and how to generate more in order to keep the doors open, the bills paid and employees funded. In this infographic, Bplans covers some of the main sources of funding you can secure for your startup business.
The Weirdest Foods You Can Grow in Your Garden
Are you stuck in a rut growing the same old beans, roots and berries or maybe even not knowing what to start growing? Well be stuck no more and take your fruit and veg patch to the next level with some crops that are sure to impress. This infographic from Heiton Buckley looks at some of the weirdest foods you can grow in your garden.
eCommerce: Visual Merchandising Tips
40% of people will respond better to visual information than plain text. Give your visitors a great shopping experience through visuals. Here are some tips to make the visual merchandising on your eCommerce store more effective.
Dog Treats vs Poison
It’s not always easy to judge what is and what isn’t healthy for your dog to eat, and there may be some things that you think are healthy which are actually bad for them. This infographic will run down some of foods that can be considered treats and those that are poison.
Cerebral Palsy – Facts & Figures
Here is a visual representation of facts about Cerebral Palsy and also UK statistics, from the types of Cerebral Palsy, the causes and ranges of treatment available.

Death & Taxes – Are You Financially Ready to Die?
Almost two thirds of UK adults do not have a will, and almost a quarter of Britons have never even thought about writing one! Every year £8 million goes to the government in money and property left behind by those that haven’t left a will. Here’s an infographic which highlights some simple facts and tips about preparing financially for death.
The Filthiest Tourist Attractions on the Planet
Want to know where some of the dirtiest, germiest and grimiest popular tourist spots around the world are? Hassle.com have put together this list including the likes of the Blarney Stone in Ireland, Seattle’s famous ‘Gum Wall’ and the creepy ‘Island of the Dolls’ in Mexico.
Light Up Your Home Office
Your home office should be properly and evenly lit with indirect lighting. It is recommended that you avoid overhead lighting where possible. Your office space should be lit so that there is no shadow or dead zones. This infographic from Beautiful Things Lighting aims at helping individuals understand the importance of using appropriate lighting in an office.
The Power of Smiling
Everyone loves to smile. Or, at least, everyone should! However, smiling isn’t just an expression of joy – it’s also a cognitive reflex to positive aspects of life that release endorphins, dopamine and serotonin – making you feel physically better. Happiness makes you smile, and smiling makes you happier – it’s a positive feedback loop that just keeps on giving.
Six Productivity Hacks Backed By Science
If you are looking for some creative productivity hacks, one which are backed by science, CourseFinder has put together some fantastic tips for you in this infographic.
How To Secure Funding for Your Startup
Anyone hoping to enter the entrepreneurial arena needs to first calculate how much cash they’ll need on hand, and how to generate more in order to keep the doors open, the bills paid and employees funded. In this infographic, Bplans covers some of the main sources of funding you can secure for your startup business.
The Weirdest Foods You Can Grow in Your Garden
Are you stuck in a rut growing the same old beans, roots and berries or maybe even not knowing what to start growing? Well be stuck no more and take your fruit and veg patch to the next level with some crops that are sure to impress. This infographic from Heiton Buckley looks at some of the weirdest foods you can grow in your garden.
eCommerce: Visual Merchandising Tips
40% of people will respond better to visual information than plain text. Give your visitors a great shopping experience through visuals. Here are some tips to make the visual merchandising on your eCommerce store more effective.
Dog Treats vs Poison
It’s not always easy to judge what is and what isn’t healthy for your dog to eat, and there may be some things that you think are healthy which are actually bad for them. This infographic will run down some of foods that can be considered treats and those that are poison.
Cerebral Palsy – Facts & Figures
Here is a visual representation of facts about Cerebral Palsy and also UK statistics, from the types of Cerebral Palsy, the causes and ranges of treatment available.
Death & Taxes – Are You Financially Ready to Die?
Almost two thirds of UK adults do not have a will, and almost a quarter of Britons have never even thought about writing one! Every year £8 million goes to the government in money and property left behind by those that haven’t left a will. Here’s an infographic which highlights some simple facts and tips about preparing financially for death.
Partners


Browse Archives By Category
Animated Infographics
Business Infographics
Career & Jobs Infographics
Education Infographics
Entertainment Industry Infographics
Environmental Infographics
Finance & Money Infographics
Food & Drink Infographics
Health Infographics
Historical Infographics
Home & Garden Infographics
Internet Infographics
Law and Legal Infographics
Lifestyle Infographics
Marketing Infographics
Offbeat Infographics
Parenting Infographics
Pets & Animals Infographics
Political Infographics
Shopping Infographics
Sports and Athletic Infographics
Technology Infographics
Transportation Infographics
Travel Infographics
Video Infographics