Search 12,000+ Infographics!
A Guy’s Guide to Buying an Engagement Ring
This infographic by Gear Jewellers explores much more than traditional jewelry finding tips. They take the guy’s side, and help him with the process of buying a ring. From before he even steps into a jewelers, to long after the proposal, this infographic provides simple, straight-forward, manly advice on choosing the perfect engagement ring.
Who Are The Safest Drivers In Canada?
By taking a driver survey, age, traffic infractions, and traffic convictions into account, Canadian car insurance company Kanetix.ca identifies the single group in Canada that actually drives the safest. Which group is that? Check out the graphic, the answer might surprise you.
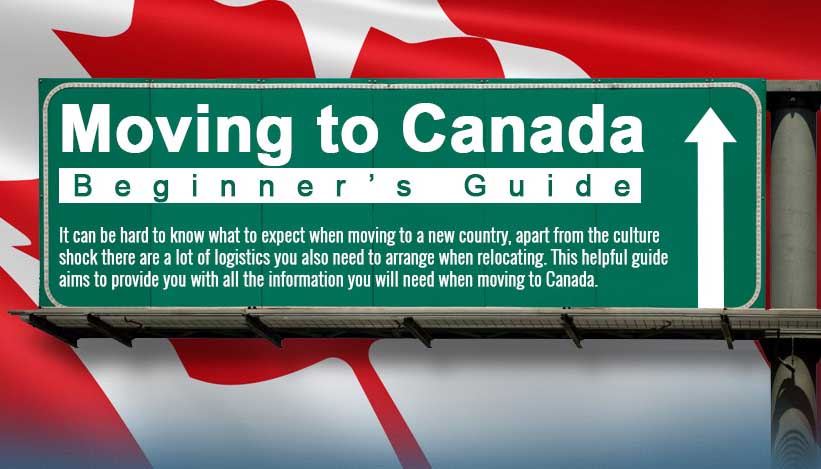
Moving to Canada: Beginner’s Guide
Moving to a new country is often one of the biggest life changes you will ever make. It is hard to know what to expect as you make your transition in to a new culture where protocols and ways of living may be different to your homeland. Deciding where to live, financing your move and choosing where you will work will be some of the most difficult choices you will be faced with.
Cotton, Fast Food, and Pace: How NOT to Run a Marathon
Do you participate in marathons? In 2013, more than 1,100 marathons were held in the U.S. with 541,000 finishers—an all-time high. That means 308,400 men and 232,600 women ran 26.2 miles at least once last year. And a record 254,300 of those runners were older than 40.
10 Bizarre Inventions That Never Made It To Your Home
We all love a new invention. It’s what makes the world go round. But for every single good invention, there are 1000’s of inventions that are just plain bizarre. MySofaBeds decided to research 10 of the most bizarre inventions for your home that didn’t quite make the cut commercially.
Divide Et Impera: A Historical Guide to Poker Strategies
This infographic put together by Full Tilt Poker is the guide for poker players who need lessons from the great tacticians. It is a historical guide to poker strategies.
Health Benefits of Music
If you are someone who enjoys listening to music or going to concerts then there is good news, it has been scientifically proven that listening to music is good for your health. Listening to music can reduce stress, relieve pain and improve brain power and this infographic even shows that live music gives more benefits than recorded music.
The History of Light
In this infographic, travel back through time to the beginning of light and find out how cave people lit their way using insect lamps. We will explore the invention of electric lighting, all the way through to modern day and futuristic predictions of lightsabers and lighting technology.
7 Tips To Boost Productivity
Looking for ways you can help your brain and body to become more productive? We often look for outside factors to why we are lazy but it is often inside us that is causing the problems. This infographic provides 7 tips that will help you boost productivity.
History of Sewing Machine
Believe it or not, the sewing machine has to be one of the most useful inventions ever. However have you ever happened to ponder on where they came from and who originally invented them? In the following infographic, Terrys Fabrics has put together a historical timeline of inventors and creative makers for you to take a look at.
Partners
Browse Archives By Category
Animated Infographics
Business Infographics
Career & Jobs Infographics
Education Infographics
Entertainment Industry Infographics
Environmental Infographics
Finance & Money Infographics
Food & Drink Infographics
Health Infographics
Historical Infographics
Home & Garden Infographics
Internet Infographics
Law and Legal Infographics
Lifestyle Infographics
Marketing Infographics
Offbeat Infographics
Parenting Infographics
Pets & Animals Infographics
Political Infographics
Shopping Infographics
Sports and Athletic Infographics
Technology Infographics
Transportation Infographics
Travel Infographics
Video Infographics


