


Search 12,100+ Infographics!
The Complete Guide To YouTube Playlists
Most everyone reading this has either used YouTube or if you are like me, use it on a daily basis. One of the features YouTube is the ability to create Playlists. In essence, YouTube Playlists allow you to organize your content in a logical order. You can think of a playlist like a music album and the videos in the playlist are the songs.

How Consumers Foot The Bill For Data Breaches
Many consumers don’t realize they often end up footing the bill for data breaches where their personal data is not even compromised. This usually happens by the companies who are affected by the data breach passing the costs onto consumers with higher prices. Here is an infographic that shows how consumers end up footing the bill for data breaches.
Top 10 Luxury Islands of the World
There are some amazing places in this world, including several luxurious islands that are simply paradise on earth. The team at Samujana recently decided to put together a infographic based on research on cost of living, accommodation and transport for some of the world’s most amazing islands.
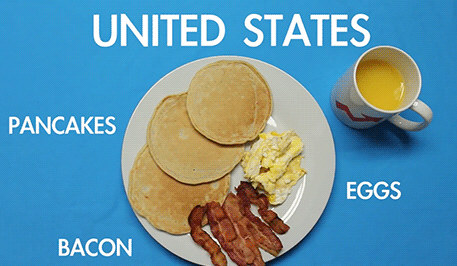
Breakfast Around the World
Okay so this is not a traditional infographic but all the same it is “data visualized” that I found very interesting. I originally discovered it on timatataciou’s Tumblr account and have re-posted the animated GIF images here. This will give you a general idea of how various cultures do breakfast around the world.
How To Do An Accurate Urine Test For Pregnancy
Getting pregnant is a delightful thing, one that can only be experienced first-hand! If you are one of those who are planning to add that cute little addition to the family, checking the status through a urine test may be a common option. Most women use home pregnancy test kits to do a urine test. This is a quick way to indicate whether you are pregnant.
A Guy’s Guide to Buying an Engagement Ring
This infographic by Gear Jewellers explores much more than traditional jewelry finding tips. They take the guy’s side, and help him with the process of buying a ring. From before he even steps into a jewelers, to long after the proposal, this infographic provides simple, straight-forward, manly advice on choosing the perfect engagement ring.
Who Are The Safest Drivers In Canada?
By taking a driver survey, age, traffic infractions, and traffic convictions into account, Canadian car insurance company Kanetix.ca identifies the single group in Canada that actually drives the safest. Which group is that? Check out the graphic, the answer might surprise you.
Moving to Canada: Beginner’s Guide
Moving to a new country is often one of the biggest life changes you will ever make. It is hard to know what to expect as you make your transition in to a new culture where protocols and ways of living may be different to your homeland. Deciding where to live, financing your move and choosing where you will work will be some of the most difficult choices you will be faced with.
Cotton, Fast Food, and Pace: How NOT to Run a Marathon
Do you participate in marathons? In 2013, more than 1,100 marathons were held in the U.S. with 541,000 finishers—an all-time high. That means 308,400 men and 232,600 women ran 26.2 miles at least once last year. And a record 254,300 of those runners were older than 40.
10 Bizarre Inventions That Never Made It To Your Home
We all love a new invention. It’s what makes the world go round. But for every single good invention, there are 1000’s of inventions that are just plain bizarre. MySofaBeds decided to research 10 of the most bizarre inventions for your home that didn’t quite make the cut commercially.
The Complete Guide To YouTube Playlists
Most everyone reading this has either used YouTube or if you are like me, use it on a daily basis. One of the features YouTube is the ability to create Playlists. In essence, YouTube Playlists allow you to organize your content in a logical order. You can think of a playlist like a music album and the videos in the playlist are the songs.
How Consumers Foot The Bill For Data Breaches
Many consumers don’t realize they often end up footing the bill for data breaches where their personal data is not even compromised. This usually happens by the companies who are affected by the data breach passing the costs onto consumers with higher prices. Here is an infographic that shows how consumers end up footing the bill for data breaches.
Top 10 Luxury Islands of the World
There are some amazing places in this world, including several luxurious islands that are simply paradise on earth. The team at Samujana recently decided to put together a infographic based on research on cost of living, accommodation and transport for some of the world’s most amazing islands.
Breakfast Around the World
Okay so this is not a traditional infographic but all the same it is “data visualized” that I found very interesting. I originally discovered it on timatataciou’s Tumblr account and have re-posted the animated GIF images here. This will give you a general idea of how various cultures do breakfast around the world.
How To Do An Accurate Urine Test For Pregnancy
Getting pregnant is a delightful thing, one that can only be experienced first-hand! If you are one of those who are planning to add that cute little addition to the family, checking the status through a urine test may be a common option. Most women use home pregnancy test kits to do a urine test. This is a quick way to indicate whether you are pregnant.
A Guy’s Guide to Buying an Engagement Ring
This infographic by Gear Jewellers explores much more than traditional jewelry finding tips. They take the guy’s side, and help him with the process of buying a ring. From before he even steps into a jewelers, to long after the proposal, this infographic provides simple, straight-forward, manly advice on choosing the perfect engagement ring.
Who Are The Safest Drivers In Canada?
By taking a driver survey, age, traffic infractions, and traffic convictions into account, Canadian car insurance company Kanetix.ca identifies the single group in Canada that actually drives the safest. Which group is that? Check out the graphic, the answer might surprise you.
Moving to Canada: Beginner’s Guide
Moving to a new country is often one of the biggest life changes you will ever make. It is hard to know what to expect as you make your transition in to a new culture where protocols and ways of living may be different to your homeland. Deciding where to live, financing your move and choosing where you will work will be some of the most difficult choices you will be faced with.
Cotton, Fast Food, and Pace: How NOT to Run a Marathon
Do you participate in marathons? In 2013, more than 1,100 marathons were held in the U.S. with 541,000 finishers—an all-time high. That means 308,400 men and 232,600 women ran 26.2 miles at least once last year. And a record 254,300 of those runners were older than 40.
10 Bizarre Inventions That Never Made It To Your Home
We all love a new invention. It’s what makes the world go round. But for every single good invention, there are 1000’s of inventions that are just plain bizarre. MySofaBeds decided to research 10 of the most bizarre inventions for your home that didn’t quite make the cut commercially.
Partners


Browse Archives By Category
Animated Infographics
Business Infographics
Career & Jobs Infographics
Education Infographics
Entertainment Industry Infographics
Environmental Infographics
Finance & Money Infographics
Food & Drink Infographics
Health Infographics
Historical Infographics
Home & Garden Infographics
Internet Infographics
Law and Legal Infographics
Lifestyle Infographics
Marketing Infographics
Offbeat Infographics
Parenting Infographics
Pets & Animals Infographics
Political Infographics
Shopping Infographics
Sports and Athletic Infographics
Technology Infographics
Transportation Infographics
Travel Infographics
Video Infographics