


Search 12,100+ Infographics!
Sativa vs Indica: The Two Major Strains of Cannabis
Many medicinal marijuana users aren’t aware that there are two very different strains of the cannabis plant. Here is a visual depiction from Vaped Canada of the major differences between the marijuana strains: Indica and Sativa.
Driving – What’s the Norm Worldwide
Driving is a major part of our day to day lives. We spend time behind the wheel getting to work, going to college or school and generally getting from one place to another. It allows us freedom to move to get to new places. Rules of the road vary worldwide. In some countries they drive on the left hand side and others on the right. There are some historical reasons for this.
A Census of Our Lost Lifetimes
It is a sad reality that substance abuse can cut lives short. To better visualize just how much potential has been lost, 12 Keys Rehab compared the years lost to substance abuse to census data to see how those lifetimes could have played out if things were different.
What Do People Read on the Toilet
A recent survey shows 63% of people read books, magazines and newspapers while on the toilet. People spend an average of 30 minutes in the bathroom every day. Check out this this infographic and see what exactly everyone is reading and what health problems it might cause.
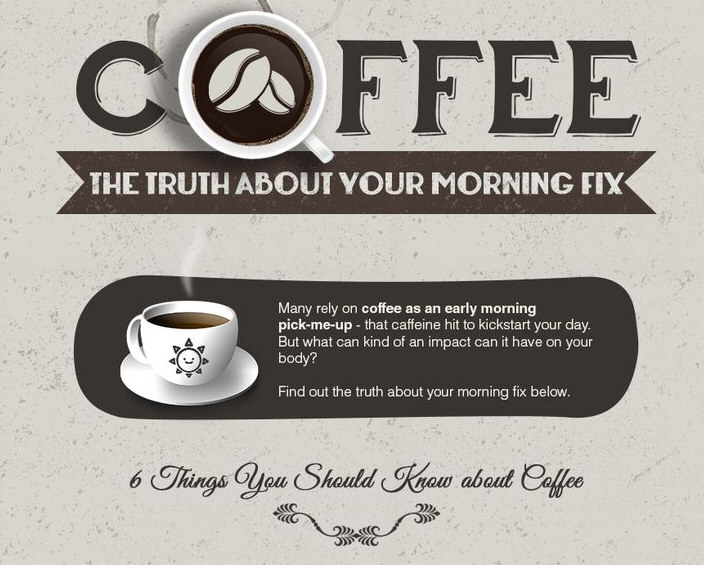
Coffee – The Truth About Your Morning Fix
This infographic by Evoke.ie offers an insight into the world of coffee that you perhaps never considered, including the amount of calories in different types of coffee drinks, how do calories compare in different coffee chains and what researchers say about coffee addiction.

What Does 200 Calories Look Like?
This infographic compares different food types and drinks of 200 calories. For example, for 200 calories you can expect to get 588 grams broccoli or 51 grams of gummy bears. There is obviously a huge difference there in terms of quantity. Of course, this says something about the quality of the food too. Having knowledge like this will most definitely make you look at certain foods in a different way.
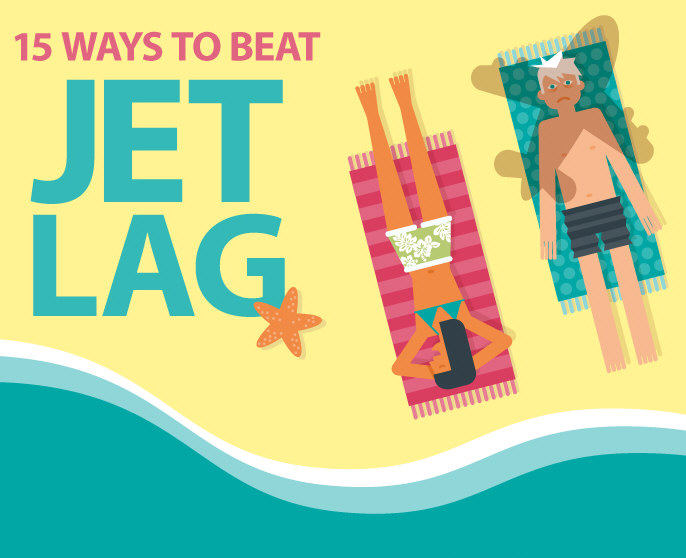
15 Ways To Beat Jet Lag
The symptoms of jet lag affect us in different ways and unfortunately, the older you get, the more susceptible you become. But no need to worry, because with a little bit of forward thinking, you can beat jet lag and knock it on the head before it knocks you for six. There are ways more effective than you know to beat jet lag which is detailed in this infographic.
Death In the Digital Age
Over a quarter of the world’s population currently uses social media, and with more and more people joining social media networks and a digital generation getting older, this infographic explores what happens after someone dies in their digital afterlife. It reveals various ways in which you can choose to deal with a deceased loved one’s social profiles, and also explores some ways you can pre-plan your digital afterlife.
Tips To Survive Music Festivals
Are you going to a music festival this summer? Not sure what to take with you? Take a look at this fun infographic which is filled with top tips when it comes to surviving camping at a music festival this summer.
The Impact of Brand Storytelling
In the pursuit of deeper connections with their desired audience, brands leave behind traditional advertising and find that providing compelling branded content is what really moves consumers to be a part of their story – their brand story. This infographic from PlayNetwork illustrates the importance of brand storytelling, from the consumer’s viewpoint.
Sativa vs Indica: The Two Major Strains of Cannabis
Many medicinal marijuana users aren’t aware that there are two very different strains of the cannabis plant. Here is a visual depiction from Vaped Canada of the major differences between the marijuana strains: Indica and Sativa.
Driving – What’s the Norm Worldwide
Driving is a major part of our day to day lives. We spend time behind the wheel getting to work, going to college or school and generally getting from one place to another. It allows us freedom to move to get to new places. Rules of the road vary worldwide. In some countries they drive on the left hand side and others on the right. There are some historical reasons for this.
A Census of Our Lost Lifetimes
It is a sad reality that substance abuse can cut lives short. To better visualize just how much potential has been lost, 12 Keys Rehab compared the years lost to substance abuse to census data to see how those lifetimes could have played out if things were different.
What Do People Read on the Toilet
A recent survey shows 63% of people read books, magazines and newspapers while on the toilet. People spend an average of 30 minutes in the bathroom every day. Check out this this infographic and see what exactly everyone is reading and what health problems it might cause.
Coffee – The Truth About Your Morning Fix
This infographic by Evoke.ie offers an insight into the world of coffee that you perhaps never considered, including the amount of calories in different types of coffee drinks, how do calories compare in different coffee chains and what researchers say about coffee addiction.
What Does 200 Calories Look Like?
This infographic compares different food types and drinks of 200 calories. For example, for 200 calories you can expect to get 588 grams broccoli or 51 grams of gummy bears. There is obviously a huge difference there in terms of quantity. Of course, this says something about the quality of the food too. Having knowledge like this will most definitely make you look at certain foods in a different way.
15 Ways To Beat Jet Lag
The symptoms of jet lag affect us in different ways and unfortunately, the older you get, the more susceptible you become. But no need to worry, because with a little bit of forward thinking, you can beat jet lag and knock it on the head before it knocks you for six. There are ways more effective than you know to beat jet lag which is detailed in this infographic.
Death In the Digital Age
Over a quarter of the world’s population currently uses social media, and with more and more people joining social media networks and a digital generation getting older, this infographic explores what happens after someone dies in their digital afterlife. It reveals various ways in which you can choose to deal with a deceased loved one’s social profiles, and also explores some ways you can pre-plan your digital afterlife.
Tips To Survive Music Festivals
Are you going to a music festival this summer? Not sure what to take with you? Take a look at this fun infographic which is filled with top tips when it comes to surviving camping at a music festival this summer.
The Impact of Brand Storytelling
In the pursuit of deeper connections with their desired audience, brands leave behind traditional advertising and find that providing compelling branded content is what really moves consumers to be a part of their story – their brand story. This infographic from PlayNetwork illustrates the importance of brand storytelling, from the consumer’s viewpoint.
Partners


Browse Archives By Category
Animated Infographics
Business Infographics
Career & Jobs Infographics
Education Infographics
Entertainment Industry Infographics
Environmental Infographics
Finance & Money Infographics
Food & Drink Infographics
Health Infographics
Historical Infographics
Home & Garden Infographics
Internet Infographics
Law and Legal Infographics
Lifestyle Infographics
Marketing Infographics
Offbeat Infographics
Parenting Infographics
Pets & Animals Infographics
Political Infographics
Shopping Infographics
Sports and Athletic Infographics
Technology Infographics
Transportation Infographics
Travel Infographics
Video Infographics