


Search 12,100+ Infographics!
Recycling Of Electronics
Every 1 to 3 years people are replacing their electronic devices and every year electronic device sales are increasing. That is why in this infographic, weSRCH shows why electronics devices recycling is more important than ever.
FIFA World Cup 2014 in Numbers
Here is a short infographic with statistics on the football world cup 2014 hosted by Brazil giving out data about the tournament in terms of the costs, tickets, players, technology to be used, impact of the event on the country’s economy & expectations from FIFA World Cup 2014.
The Facts You Didn’t Know About Keepy-Ups
Ever wanted to know who the world record holder for keepie-ups is? Or where the keepie-up originated from? Look no further. 888sport have created this infographic all about the facts you didn’t know about keepie-ups.
Once Upon A Time in Content Marketing Land
“Once Upon A Time in Content Marketing Land” is an infographic created by Syndacast to highlight the prominent aspects and importance of content marketing in 2014.

Putting Forests to Work
Forests are the largest terrestrial carbon sink by far. In fact, forests absorb nearly 90 percent more carbon than the next largest source. Check out the following infographic to learn more about what the forests do for us and how we need to keep them around.
An A-Z of Forgotten Cocktails
The following infographic from LoveAntiques.com entitled, “An A-Z of Forgotten Cocktails” includes all you need to learn more about your favorite cocktails, some present and some long forgotten.
De-clutter Your Home
If you regularly struggle to find everyday items like keys, wallets, cups of tea, etc., then maybe you’re facing the household pest that is called “clutter.” The average American spends around 55 minutes a day looking for things in their home, and 96% said they thought they would have more time if their home was more organized. So why not take a look at these handy de-cluttering tips to keep your home in order and make life that little bit easier.

Headed to College? Ditch These High-School Habits
Congratulations on completing your senior year of high-school. Now you are heading off to college in a few months away so why not use that time to prepare for the experience by ditching the high-school mentality, opening your mind for the changes ahead, and getting into some good habits now so you can start freshman year off right? This infographic will help you.
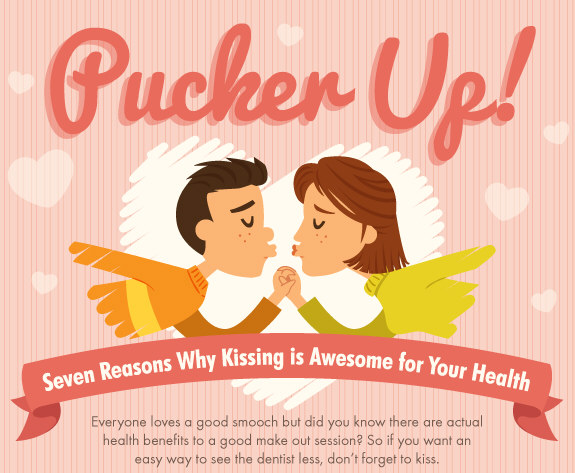
Pucker Up! Seven Reason Why Kissing Is Awesome For Your Health
Most people can agree that kissing is a good thing. We spend a solid chunk of our lives doing it but thanks to modern science we now know that there are actual real life health benefits to a good make out session. The following infographic provides seven reasons why kissing is awesome for your health.
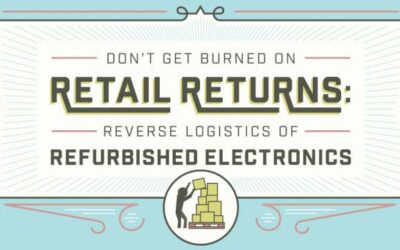
Don’t Get Burned On Retail Returns
Returns can be a hassle. Especially for retailers. Check out the following infographic presented by DirectLiguidation.com to learn about the reverse logistics of refurbished electronics.
Recycling Of Electronics
Every 1 to 3 years people are replacing their electronic devices and every year electronic device sales are increasing. That is why in this infographic, weSRCH shows why electronics devices recycling is more important than ever.
FIFA World Cup 2014 in Numbers
Here is a short infographic with statistics on the football world cup 2014 hosted by Brazil giving out data about the tournament in terms of the costs, tickets, players, technology to be used, impact of the event on the country’s economy & expectations from FIFA World Cup 2014.
The Facts You Didn’t Know About Keepy-Ups
Ever wanted to know who the world record holder for keepie-ups is? Or where the keepie-up originated from? Look no further. 888sport have created this infographic all about the facts you didn’t know about keepie-ups.
Once Upon A Time in Content Marketing Land
“Once Upon A Time in Content Marketing Land” is an infographic created by Syndacast to highlight the prominent aspects and importance of content marketing in 2014.
Putting Forests to Work
Forests are the largest terrestrial carbon sink by far. In fact, forests absorb nearly 90 percent more carbon than the next largest source. Check out the following infographic to learn more about what the forests do for us and how we need to keep them around.
An A-Z of Forgotten Cocktails
The following infographic from LoveAntiques.com entitled, “An A-Z of Forgotten Cocktails” includes all you need to learn more about your favorite cocktails, some present and some long forgotten.
De-clutter Your Home
If you regularly struggle to find everyday items like keys, wallets, cups of tea, etc., then maybe you’re facing the household pest that is called “clutter.” The average American spends around 55 minutes a day looking for things in their home, and 96% said they thought they would have more time if their home was more organized. So why not take a look at these handy de-cluttering tips to keep your home in order and make life that little bit easier.
Headed to College? Ditch These High-School Habits
Congratulations on completing your senior year of high-school. Now you are heading off to college in a few months away so why not use that time to prepare for the experience by ditching the high-school mentality, opening your mind for the changes ahead, and getting into some good habits now so you can start freshman year off right? This infographic will help you.
Pucker Up! Seven Reason Why Kissing Is Awesome For Your Health
Most people can agree that kissing is a good thing. We spend a solid chunk of our lives doing it but thanks to modern science we now know that there are actual real life health benefits to a good make out session. The following infographic provides seven reasons why kissing is awesome for your health.
Don’t Get Burned On Retail Returns
Returns can be a hassle. Especially for retailers. Check out the following infographic presented by DirectLiguidation.com to learn about the reverse logistics of refurbished electronics.
Partners


Browse Archives By Category
Animated Infographics
Business Infographics
Career & Jobs Infographics
Education Infographics
Entertainment Industry Infographics
Environmental Infographics
Finance & Money Infographics
Food & Drink Infographics
Health Infographics
Historical Infographics
Home & Garden Infographics
Internet Infographics
Law and Legal Infographics
Lifestyle Infographics
Marketing Infographics
Offbeat Infographics
Parenting Infographics
Pets & Animals Infographics
Political Infographics
Shopping Infographics
Sports and Athletic Infographics
Technology Infographics
Transportation Infographics
Travel Infographics
Video Infographics