


Search 12,100+ Infographics!
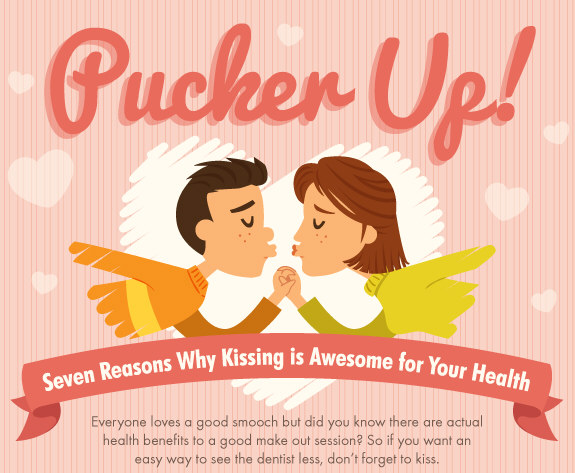
Pucker Up! Seven Reason Why Kissing Is Awesome For Your Health
Most people can agree that kissing is a good thing. We spend a solid chunk of our lives doing it but thanks to modern science we now know that there are actual real life health benefits to a good make out session. The following infographic provides seven reasons why kissing is awesome for your health.

Don’t Get Burned On Retail Returns
Returns can be a hassle. Especially for retailers. Check out the following infographic presented by DirectLiguidation.com to learn about the reverse logistics of refurbished electronics.
12 Free and Low-Cost Tools to Help You Create Amazing Pinterest Graphics
Ever wonder how so many posts that you see on Pinterest, Instagram, and Facebook have great looking visuals? We all know that visual social media marketing is important, but how can we create great looking graphics if we don’t have a full-time designer in house? What if you just wanted to create a quick graphic when you don’t have a lot of time on your hands?
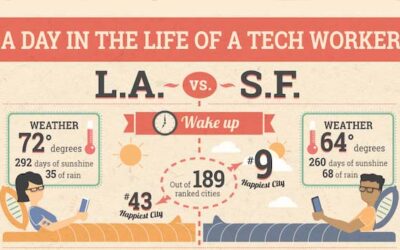
LA vs SF – Where Do Tech Workers Have It Better?
Over the last couple years, startups have increasingly passed over tech epicenter SF in favor of the burgeoning startup scene in the sunny south. Intrigued, the team at tech career marketplace Hired.com decided to dig a little deeper in an attempt to figure out where the urban living is best for techies.

Comic Con International San Diego: All You Need to Know Guide
San Diego Comic Con is the Mecca of Geekdom. Each year thousands upon thousands of comic book, movie and pop culture enthusiasts descend on San Diego to revel in their collective geekery. From movies to TV shows to comic books to collectible action figures, Comic Con has it all.
Everyone’s Doing It: What Today’s Teens Think About Marijuana
Weed is becoming as common place in our schools as textbooks and raging hormones. Teen marijuana use is at a 30 year high and the really scary thing is that more and more teens think using weed isn’t a big deal and that it’s a “safe” drug. Truth is, this is not the case. The following infographic from HelpYourTeenNow explains why.
The Difference Between the Cold & the Flu
Ever wondered how to spot the difference between the Cold or the Flu? Vaccine Hub’s “Flu” infographic visually displays cold versus flu symptoms including explanations on the symptom duration in addition to prevention and treatment information.
Challenges & Opportunities for SMEs in an Aging Population
Managing an aging population holds its challenges, but businesses can also tap into the benefits that it brings and reap the rewards. This infographic from The Executive Connection gives you the information you need to do so.
Social Media in The Workplace
Recent studies have shown that allowing employees to use the Internet for personal reasons at work can actually boost productivity and even foster better relationships in the workplace. Check out the infographic by Whitefields Document Storage for more information on why allowing social media at work is a great idea.
Prom Gown Breakdown: How to Rock the Right Gown
Spring is here, and for the teens of America, this means prom season. Girls spanning the nation will thumb through racks and walk through malls on the never-ending search for the perfect gown. Here is an infographic looking at which cuts to choose for different body types, and how to dress to impress for prom.
Pucker Up! Seven Reason Why Kissing Is Awesome For Your Health
Most people can agree that kissing is a good thing. We spend a solid chunk of our lives doing it but thanks to modern science we now know that there are actual real life health benefits to a good make out session. The following infographic provides seven reasons why kissing is awesome for your health.
Don’t Get Burned On Retail Returns
Returns can be a hassle. Especially for retailers. Check out the following infographic presented by DirectLiguidation.com to learn about the reverse logistics of refurbished electronics.
12 Free and Low-Cost Tools to Help You Create Amazing Pinterest Graphics
Ever wonder how so many posts that you see on Pinterest, Instagram, and Facebook have great looking visuals? We all know that visual social media marketing is important, but how can we create great looking graphics if we don’t have a full-time designer in house? What if you just wanted to create a quick graphic when you don’t have a lot of time on your hands?
LA vs SF – Where Do Tech Workers Have It Better?
Over the last couple years, startups have increasingly passed over tech epicenter SF in favor of the burgeoning startup scene in the sunny south. Intrigued, the team at tech career marketplace Hired.com decided to dig a little deeper in an attempt to figure out where the urban living is best for techies.
Comic Con International San Diego: All You Need to Know Guide
San Diego Comic Con is the Mecca of Geekdom. Each year thousands upon thousands of comic book, movie and pop culture enthusiasts descend on San Diego to revel in their collective geekery. From movies to TV shows to comic books to collectible action figures, Comic Con has it all.
Everyone’s Doing It: What Today’s Teens Think About Marijuana
Weed is becoming as common place in our schools as textbooks and raging hormones. Teen marijuana use is at a 30 year high and the really scary thing is that more and more teens think using weed isn’t a big deal and that it’s a “safe” drug. Truth is, this is not the case. The following infographic from HelpYourTeenNow explains why.
The Difference Between the Cold & the Flu
Ever wondered how to spot the difference between the Cold or the Flu? Vaccine Hub’s “Flu” infographic visually displays cold versus flu symptoms including explanations on the symptom duration in addition to prevention and treatment information.
Challenges & Opportunities for SMEs in an Aging Population
Managing an aging population holds its challenges, but businesses can also tap into the benefits that it brings and reap the rewards. This infographic from The Executive Connection gives you the information you need to do so.
Social Media in The Workplace
Recent studies have shown that allowing employees to use the Internet for personal reasons at work can actually boost productivity and even foster better relationships in the workplace. Check out the infographic by Whitefields Document Storage for more information on why allowing social media at work is a great idea.
Prom Gown Breakdown: How to Rock the Right Gown
Spring is here, and for the teens of America, this means prom season. Girls spanning the nation will thumb through racks and walk through malls on the never-ending search for the perfect gown. Here is an infographic looking at which cuts to choose for different body types, and how to dress to impress for prom.
Partners


Browse Archives By Category
Animated Infographics
Business Infographics
Career & Jobs Infographics
Education Infographics
Entertainment Industry Infographics
Environmental Infographics
Finance & Money Infographics
Food & Drink Infographics
Health Infographics
Historical Infographics
Home & Garden Infographics
Internet Infographics
Law and Legal Infographics
Lifestyle Infographics
Marketing Infographics
Offbeat Infographics
Parenting Infographics
Pets & Animals Infographics
Political Infographics
Shopping Infographics
Sports and Athletic Infographics
Technology Infographics
Transportation Infographics
Travel Infographics
Video Infographics