


Search 12,100+ Infographics!
The API Revolution
Tim O’Reilly called it Web 2.0. Niclas Reimertz has dubbed it the Golden Age. Most recently, technologists like to refer to it as the Internet of Things. Regardless of the semantics, it’s clear that that we’re in the midst of a massive advancement in the way we all interact with the Internet and the connected world. What’s also clear is that APIs are standing on the front lines of these changes.
Food vs. Medicine
Should a diet change come before prescription drugs? Check out the following infographic to learn about food vs. medicine.
9 Simple Conversation Hacks: How to Turn Any Interaction in Your Favor
Whether it’s a job interview, or a serious relationship talk, communication is essential – and having a few tricks up your sleeve can’t hurt. Online Psychology Degrees has created an infographic giving you a few tips to get any conversation to turn your way.
Exploring the Okavango Delta
The Okavango Delta in Botswana is one of the best places for wildlife spotting in the Africa, if not the world. It is a seasonal wetland that attracts Africa’s big game and large cats. Botswana is one of luxury tour operator Mirus Journeys’ favourite destinations and in this infographic they share their knowledge of this amazing place.
Cats vs. Dogs
Dogs and cats are two of the most popular pets in the UK. But when you’re asked whether you’re a cat or a dog person – what’s your response? Apparently our preference in pets says a lot about our personalities. Argos Pet Insurance takes a look at the cats vs. dogs scenario in the following infographic.
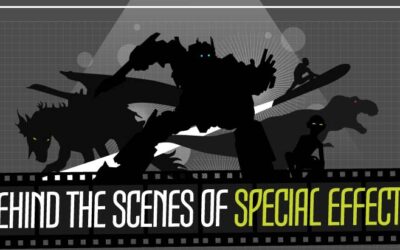
Behind the Scenes of Special Effects
You probably won’t be surprised to read that most movies made today are packed with a variety of special effects. Since the premiere of movies like Titanic, Avatar, The Great Gatsby, Inception, Lord of The Rings, and other Hollywood hits, the expectation for high-quality special effects in films has continued to rise.

The Sales Execution Challenge – How Do You Measure Up?
Many organizations are shifting from maintenance mode to growth mode in 2014 and therefore looking beyond sales enablement and towards sales execution to meet their goals. Check out the following infographic to see how you measure up in The Sales Execution Challenge.

For-Profit vs. Public College
Have you ever wondered about the differences between for-profit and public colleges? Check out this infographic to learn more.
What’s In a Logos of Famous Car Manufacturers?
Branding in today’s modern world is vital if a company wishes to have longevity. While logos and branding are often seen as something that larger, more corporate companies should focus on, this is not necessarily the case. Smaller companies who fail to recognize the importance of branding and logos will lose out in terms of business because a company, however small must have an identity.
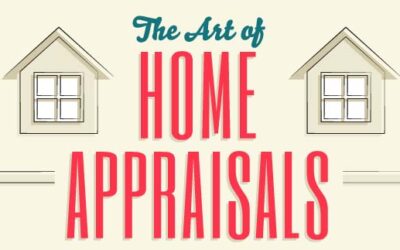
The Art and Science of Home Appraisals
On your path to home ownership, finding your dream home is just the start. You need to make sure the loan process goes smoothly and you are able to close your escrow on time. Often, something goes awry and its not uncommon for that “something” to be appraisal.
The API Revolution
Tim O’Reilly called it Web 2.0. Niclas Reimertz has dubbed it the Golden Age. Most recently, technologists like to refer to it as the Internet of Things. Regardless of the semantics, it’s clear that that we’re in the midst of a massive advancement in the way we all interact with the Internet and the connected world. What’s also clear is that APIs are standing on the front lines of these changes.
Food vs. Medicine
Should a diet change come before prescription drugs? Check out the following infographic to learn about food vs. medicine.
9 Simple Conversation Hacks: How to Turn Any Interaction in Your Favor
Whether it’s a job interview, or a serious relationship talk, communication is essential – and having a few tricks up your sleeve can’t hurt. Online Psychology Degrees has created an infographic giving you a few tips to get any conversation to turn your way.
Exploring the Okavango Delta
The Okavango Delta in Botswana is one of the best places for wildlife spotting in the Africa, if not the world. It is a seasonal wetland that attracts Africa’s big game and large cats. Botswana is one of luxury tour operator Mirus Journeys’ favourite destinations and in this infographic they share their knowledge of this amazing place.
Cats vs. Dogs
Dogs and cats are two of the most popular pets in the UK. But when you’re asked whether you’re a cat or a dog person – what’s your response? Apparently our preference in pets says a lot about our personalities. Argos Pet Insurance takes a look at the cats vs. dogs scenario in the following infographic.
Behind the Scenes of Special Effects
You probably won’t be surprised to read that most movies made today are packed with a variety of special effects. Since the premiere of movies like Titanic, Avatar, The Great Gatsby, Inception, Lord of The Rings, and other Hollywood hits, the expectation for high-quality special effects in films has continued to rise.
The Sales Execution Challenge – How Do You Measure Up?
Many organizations are shifting from maintenance mode to growth mode in 2014 and therefore looking beyond sales enablement and towards sales execution to meet their goals. Check out the following infographic to see how you measure up in The Sales Execution Challenge.
For-Profit vs. Public College
Have you ever wondered about the differences between for-profit and public colleges? Check out this infographic to learn more.
What’s In a Logos of Famous Car Manufacturers?
Branding in today’s modern world is vital if a company wishes to have longevity. While logos and branding are often seen as something that larger, more corporate companies should focus on, this is not necessarily the case. Smaller companies who fail to recognize the importance of branding and logos will lose out in terms of business because a company, however small must have an identity.
The Art and Science of Home Appraisals
On your path to home ownership, finding your dream home is just the start. You need to make sure the loan process goes smoothly and you are able to close your escrow on time. Often, something goes awry and its not uncommon for that “something” to be appraisal.
Partners


Browse Archives By Category
Animated Infographics
Business Infographics
Career & Jobs Infographics
Education Infographics
Entertainment Industry Infographics
Environmental Infographics
Finance & Money Infographics
Food & Drink Infographics
Health Infographics
Historical Infographics
Home & Garden Infographics
Internet Infographics
Law and Legal Infographics
Lifestyle Infographics
Marketing Infographics
Offbeat Infographics
Parenting Infographics
Pets & Animals Infographics
Political Infographics
Shopping Infographics
Sports and Athletic Infographics
Technology Infographics
Transportation Infographics
Travel Infographics
Video Infographics