


Search 12,100+ Infographics!
Space Internet
The idea of space internet is nothing new. Check out the following infographic by computersciencedegreehub.com to get a deeper look at global internet via satellite.
PRO’s vs. JOE’s (and Jane’s) – Personal Training vs. DIY Workouts
For anyone who’s considered investing in a fitness program, this infographic was developed just for you. It compares the pros and cons of both options to help you decide which solution is best for you.
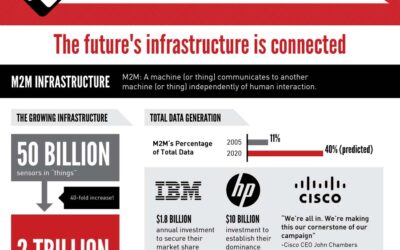
The Future of a Connected Field Technician
The future for field technicians is here and it’s called M2M. Check out the following infographic to learn more about M2M and how it will change the infrastructure for field techs.
The World According to Cats
In ancient times cats are considered guardians of the underworld. That is why they are considered sacred in many societies. For more information about these beloved felines, here’s an infographic about the world according to cats. You will be amazed the bulk of information that you will accumulate.
Homeowner’s Guide to Saving Money & Energy
Ask any homeowner and they’ll tell you that owning a home isn’t easy… or cheap. But, that doesn’t mean you have to spend an outrageous amount of money to own and maintain your home. There are many things you can do to cut down your energy usage, which not only helps save you money but also the environment.
Illegal Fishing Methods and Effects
Illegal fishing and causing harm to sea life is a serious matter and the dangerous truth about it has been steadily rising to the surface in recent news stories. North East Tackle Supplies has researched some of the most shocking facts surrounding this topic to open up your eyes about taking oceans, lakes, rivers and its inhabitants for granted.
A Day In The Life of a Day Trader
If you’re someone who relies on the consistency of a 9-5 job then you’re probably not cut out to be a day trader but, if you love excitement, and the challenge to push yourself to do better every day, you should keep reading. Day traders are required to think dynamically, analytically, and creatively all at the same time.

The Science of Higher Education
Effective teachers at all levels know that students learn differently from one another: Some learn best by hearing information, others are hands-on (or “kinesthetic”) learners, and still others are visual learners. But did you know that one of those groups makes up nearly two-thirds of the population?
The Evolution of Newspaper Innovation
Did you know the average adult uses four different devices or technologies to access news in a given week? Check out the following infographic to learn about how Americans are consuming their news.
So Much Stuff!
Over the last half century, Americans began a collection: stuff. We collect everything. Our dresser drawers overflow, our closets bulge, and our garages hold cardboard boxes rather than family sedans. How did this happen? How do we put the brakes on it?
Space Internet
The idea of space internet is nothing new. Check out the following infographic by computersciencedegreehub.com to get a deeper look at global internet via satellite.
PRO’s vs. JOE’s (and Jane’s) – Personal Training vs. DIY Workouts
For anyone who’s considered investing in a fitness program, this infographic was developed just for you. It compares the pros and cons of both options to help you decide which solution is best for you.
The Future of a Connected Field Technician
The future for field technicians is here and it’s called M2M. Check out the following infographic to learn more about M2M and how it will change the infrastructure for field techs.
The World According to Cats
In ancient times cats are considered guardians of the underworld. That is why they are considered sacred in many societies. For more information about these beloved felines, here’s an infographic about the world according to cats. You will be amazed the bulk of information that you will accumulate.
Homeowner’s Guide to Saving Money & Energy
Ask any homeowner and they’ll tell you that owning a home isn’t easy… or cheap. But, that doesn’t mean you have to spend an outrageous amount of money to own and maintain your home. There are many things you can do to cut down your energy usage, which not only helps save you money but also the environment.
Illegal Fishing Methods and Effects
Illegal fishing and causing harm to sea life is a serious matter and the dangerous truth about it has been steadily rising to the surface in recent news stories. North East Tackle Supplies has researched some of the most shocking facts surrounding this topic to open up your eyes about taking oceans, lakes, rivers and its inhabitants for granted.
A Day In The Life of a Day Trader
If you’re someone who relies on the consistency of a 9-5 job then you’re probably not cut out to be a day trader but, if you love excitement, and the challenge to push yourself to do better every day, you should keep reading. Day traders are required to think dynamically, analytically, and creatively all at the same time.
The Science of Higher Education
Effective teachers at all levels know that students learn differently from one another: Some learn best by hearing information, others are hands-on (or “kinesthetic”) learners, and still others are visual learners. But did you know that one of those groups makes up nearly two-thirds of the population?
The Evolution of Newspaper Innovation
Did you know the average adult uses four different devices or technologies to access news in a given week? Check out the following infographic to learn about how Americans are consuming their news.
So Much Stuff!
Over the last half century, Americans began a collection: stuff. We collect everything. Our dresser drawers overflow, our closets bulge, and our garages hold cardboard boxes rather than family sedans. How did this happen? How do we put the brakes on it?
Partners


Browse Archives By Category
Animated Infographics
Business Infographics
Career & Jobs Infographics
Education Infographics
Entertainment Industry Infographics
Environmental Infographics
Finance & Money Infographics
Food & Drink Infographics
Health Infographics
Historical Infographics
Home & Garden Infographics
Internet Infographics
Law and Legal Infographics
Lifestyle Infographics
Marketing Infographics
Offbeat Infographics
Parenting Infographics
Pets & Animals Infographics
Political Infographics
Shopping Infographics
Sports and Athletic Infographics
Technology Infographics
Transportation Infographics
Travel Infographics
Video Infographics