


Search 12,100+ Infographics!
Behind the Scenes of Special Effects
You probably won’t be surprised to read that most movies made today are packed with a variety of special effects. Since the premiere of movies like Titanic, Avatar, The Great Gatsby, Inception, Lord of The Rings, and other Hollywood hits, the expectation for high-quality special effects in films has continued to rise.

The Sales Execution Challenge – How Do You Measure Up?
Many organizations are shifting from maintenance mode to growth mode in 2014 and therefore looking beyond sales enablement and towards sales execution to meet their goals. Check out the following infographic to see how you measure up in The Sales Execution Challenge.

For-Profit vs. Public College
Have you ever wondered about the differences between for-profit and public colleges? Check out this infographic to learn more.
What’s In a Logos of Famous Car Manufacturers?
Branding in today’s modern world is vital if a company wishes to have longevity. While logos and branding are often seen as something that larger, more corporate companies should focus on, this is not necessarily the case. Smaller companies who fail to recognize the importance of branding and logos will lose out in terms of business because a company, however small must have an identity.

The Art and Science of Home Appraisals
On your path to home ownership, finding your dream home is just the start. You need to make sure the loan process goes smoothly and you are able to close your escrow on time. Often, something goes awry and its not uncommon for that “something” to be appraisal.
Space Internet
The idea of space internet is nothing new. Check out the following infographic by computersciencedegreehub.com to get a deeper look at global internet via satellite.
PRO’s vs. JOE’s (and Jane’s) – Personal Training vs. DIY Workouts
For anyone who’s considered investing in a fitness program, this infographic was developed just for you. It compares the pros and cons of both options to help you decide which solution is best for you.
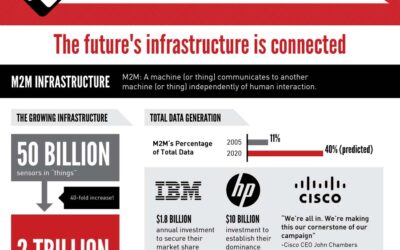
The Future of a Connected Field Technician
The future for field technicians is here and it’s called M2M. Check out the following infographic to learn more about M2M and how it will change the infrastructure for field techs.
The World According to Cats
In ancient times cats are considered guardians of the underworld. That is why they are considered sacred in many societies. For more information about these beloved felines, here’s an infographic about the world according to cats. You will be amazed the bulk of information that you will accumulate.
Homeowner’s Guide to Saving Money & Energy
Ask any homeowner and they’ll tell you that owning a home isn’t easy… or cheap. But, that doesn’t mean you have to spend an outrageous amount of money to own and maintain your home. There are many things you can do to cut down your energy usage, which not only helps save you money but also the environment.
Behind the Scenes of Special Effects
You probably won’t be surprised to read that most movies made today are packed with a variety of special effects. Since the premiere of movies like Titanic, Avatar, The Great Gatsby, Inception, Lord of The Rings, and other Hollywood hits, the expectation for high-quality special effects in films has continued to rise.
The Sales Execution Challenge – How Do You Measure Up?
Many organizations are shifting from maintenance mode to growth mode in 2014 and therefore looking beyond sales enablement and towards sales execution to meet their goals. Check out the following infographic to see how you measure up in The Sales Execution Challenge.
For-Profit vs. Public College
Have you ever wondered about the differences between for-profit and public colleges? Check out this infographic to learn more.
What’s In a Logos of Famous Car Manufacturers?
Branding in today’s modern world is vital if a company wishes to have longevity. While logos and branding are often seen as something that larger, more corporate companies should focus on, this is not necessarily the case. Smaller companies who fail to recognize the importance of branding and logos will lose out in terms of business because a company, however small must have an identity.
The Art and Science of Home Appraisals
On your path to home ownership, finding your dream home is just the start. You need to make sure the loan process goes smoothly and you are able to close your escrow on time. Often, something goes awry and its not uncommon for that “something” to be appraisal.
Space Internet
The idea of space internet is nothing new. Check out the following infographic by computersciencedegreehub.com to get a deeper look at global internet via satellite.
PRO’s vs. JOE’s (and Jane’s) – Personal Training vs. DIY Workouts
For anyone who’s considered investing in a fitness program, this infographic was developed just for you. It compares the pros and cons of both options to help you decide which solution is best for you.
The Future of a Connected Field Technician
The future for field technicians is here and it’s called M2M. Check out the following infographic to learn more about M2M and how it will change the infrastructure for field techs.
The World According to Cats
In ancient times cats are considered guardians of the underworld. That is why they are considered sacred in many societies. For more information about these beloved felines, here’s an infographic about the world according to cats. You will be amazed the bulk of information that you will accumulate.
Homeowner’s Guide to Saving Money & Energy
Ask any homeowner and they’ll tell you that owning a home isn’t easy… or cheap. But, that doesn’t mean you have to spend an outrageous amount of money to own and maintain your home. There are many things you can do to cut down your energy usage, which not only helps save you money but also the environment.
Partners


Browse Archives By Category
Animated Infographics
Business Infographics
Career & Jobs Infographics
Education Infographics
Entertainment Industry Infographics
Environmental Infographics
Finance & Money Infographics
Food & Drink Infographics
Health Infographics
Historical Infographics
Home & Garden Infographics
Internet Infographics
Law and Legal Infographics
Lifestyle Infographics
Marketing Infographics
Offbeat Infographics
Parenting Infographics
Pets & Animals Infographics
Political Infographics
Shopping Infographics
Sports and Athletic Infographics
Technology Infographics
Transportation Infographics
Travel Infographics
Video Infographics