


Search 12,100+ Infographics!
The Safest and Less Safe Neighborhoods in America
Are you thinking about moving to a big city? If so, you might want to take some time to look through the infographic we’ve put together below. In it, Protect Your Home lists the safest and less safe neighborhoods in a few of America’s largest metropolitan areas. What you read may surprise you.
The Mobile Continuum
Whether it’s working, presenting, computing, or communicating, mobile technologies are making sales teams sleeker and meeting customer needs in dynamic new ways. In the following infographic, discover a few different types of technologies that more and more B2B companies have been adopting lately.

Gamification of Education
Gamification has tremendous potential in the education space. How can we use it to deliver truly meaningful experiences to students? This infographic from Knewton looks at this in more detail.
Real Cost of Vehicle Ownership
Compare the most expensive and the cheapest vehicles to own as the depreciation is calculated and interest payments on any auto loans or bank overdraft are added. Check out the following infographic for a full listing of all the factors you should weigh before deciding what make and model to buy.
The Power of Visual Communication
Visual communication is described as the conveyance of information and ideas in forms that can be read or looked upon. According to studies, people tend to remember about 20 percent of what they read, and only ten percent of what they hear. In comparison, the same studies have shown that people tend to remember an impressive 80 percent of what they see and do.

Flipped Classroom: Turning Traditional Education On Its Head
Many educators are experimenting with the idea of a flipped classroom model. So what is it and why is everyone talking about it? Find out in this infographic from Knewton.
The Cost of Renting in New York City
More than 1 million households in New York City are rent-burdened, which means they are paying 30 percent or more of household income on rent, and nearly 600,000 of those households are severely rent-burdened, or paying more than 50 percent of their income on rent, according to the newly released NYU Furman Center/Capital One Affordable Rental Housing Landscape.
Speaking Up: Overcoming Fear of Public Speaking
We’ve all heard the old adage to view an audience in their underwear if you’re slated to perform in front of a crowd, but did you know that public speaking is the #2 most common fear? It sits firmly in the #2 position, after flying, and before heights. Top Management Degrees has created an infographic outlining the fear of public speaking, and some tips and tricks you can enlist to help you get through your next speaking engagement.
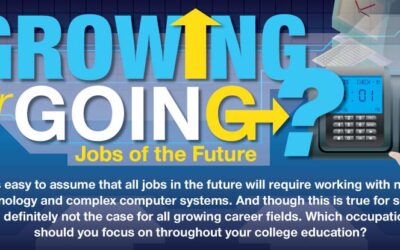
Growing or Going? Jobs of the Future
For those entering the workforce, it can be a scary time. It’s hard to know what the future may hold for many industries, but here is an infographic entitled “Growing or Going? Jobs of the Future”, showing you what industries are expected to grow, and which are expected to flop.
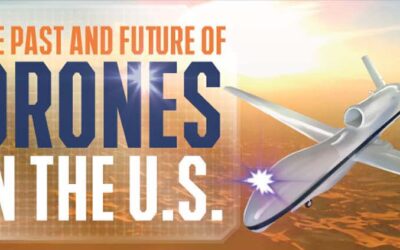
The Past and Future of Drones in the U.S.
Drones may seem like material for a science fiction movie, however, drone technology is getting more advanced every day. Criminal Justice Degree Hub has created an infographic entitled “The Past and Future of Drones in the U.S.” giving you a look into the history of drones, how they are used today, and what we might see in the future.
The Safest and Less Safe Neighborhoods in America
Are you thinking about moving to a big city? If so, you might want to take some time to look through the infographic we’ve put together below. In it, Protect Your Home lists the safest and less safe neighborhoods in a few of America’s largest metropolitan areas. What you read may surprise you.
The Mobile Continuum
Whether it’s working, presenting, computing, or communicating, mobile technologies are making sales teams sleeker and meeting customer needs in dynamic new ways. In the following infographic, discover a few different types of technologies that more and more B2B companies have been adopting lately.
Gamification of Education
Gamification has tremendous potential in the education space. How can we use it to deliver truly meaningful experiences to students? This infographic from Knewton looks at this in more detail.
Real Cost of Vehicle Ownership
Compare the most expensive and the cheapest vehicles to own as the depreciation is calculated and interest payments on any auto loans or bank overdraft are added. Check out the following infographic for a full listing of all the factors you should weigh before deciding what make and model to buy.
The Power of Visual Communication
Visual communication is described as the conveyance of information and ideas in forms that can be read or looked upon. According to studies, people tend to remember about 20 percent of what they read, and only ten percent of what they hear. In comparison, the same studies have shown that people tend to remember an impressive 80 percent of what they see and do.
Flipped Classroom: Turning Traditional Education On Its Head
Many educators are experimenting with the idea of a flipped classroom model. So what is it and why is everyone talking about it? Find out in this infographic from Knewton.
The Cost of Renting in New York City
More than 1 million households in New York City are rent-burdened, which means they are paying 30 percent or more of household income on rent, and nearly 600,000 of those households are severely rent-burdened, or paying more than 50 percent of their income on rent, according to the newly released NYU Furman Center/Capital One Affordable Rental Housing Landscape.
Speaking Up: Overcoming Fear of Public Speaking
We’ve all heard the old adage to view an audience in their underwear if you’re slated to perform in front of a crowd, but did you know that public speaking is the #2 most common fear? It sits firmly in the #2 position, after flying, and before heights. Top Management Degrees has created an infographic outlining the fear of public speaking, and some tips and tricks you can enlist to help you get through your next speaking engagement.
Growing or Going? Jobs of the Future
For those entering the workforce, it can be a scary time. It’s hard to know what the future may hold for many industries, but here is an infographic entitled “Growing or Going? Jobs of the Future”, showing you what industries are expected to grow, and which are expected to flop.
The Past and Future of Drones in the U.S.
Drones may seem like material for a science fiction movie, however, drone technology is getting more advanced every day. Criminal Justice Degree Hub has created an infographic entitled “The Past and Future of Drones in the U.S.” giving you a look into the history of drones, how they are used today, and what we might see in the future.
Partners


Browse Archives By Category
Animated Infographics
Business Infographics
Career & Jobs Infographics
Education Infographics
Entertainment Industry Infographics
Environmental Infographics
Finance & Money Infographics
Food & Drink Infographics
Health Infographics
Historical Infographics
Home & Garden Infographics
Internet Infographics
Law and Legal Infographics
Lifestyle Infographics
Marketing Infographics
Offbeat Infographics
Parenting Infographics
Pets & Animals Infographics
Political Infographics
Shopping Infographics
Sports and Athletic Infographics
Technology Infographics
Transportation Infographics
Travel Infographics
Video Infographics