


Search 12,100+ Infographics!
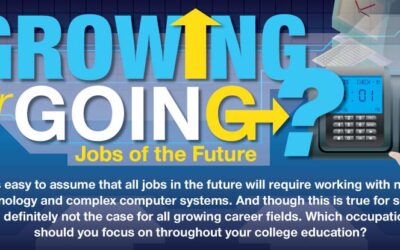
Growing or Going? Jobs of the Future
For those entering the workforce, it can be a scary time. It’s hard to know what the future may hold for many industries, but here is an infographic entitled “Growing or Going? Jobs of the Future”, showing you what industries are expected to grow, and which are expected to flop.

The Past and Future of Drones in the U.S.
Drones may seem like material for a science fiction movie, however, drone technology is getting more advanced every day. Criminal Justice Degree Hub has created an infographic entitled “The Past and Future of Drones in the U.S.” giving you a look into the history of drones, how they are used today, and what we might see in the future.
Social Jetlag: No Travel Required
When you think of jetlag, you probably imagine the effects of a flight and travel on the body. However, there is another type of jetlag – social jetlag, which can have even more worrisome effects than its jet setting counterpart. Biz Brain has created an infographic entitled “Social Jetlag: No Travel Required”, explaining what social jetlag is, how to recognize it, and how to avoid it.

Education Spending: Where Are Our Priorities?
When it comes to national spending, the amount allotted to education can be the source of heated debates. The following infographic shows just how much we’re spending, and what it compares to.

Why Employee vs. Independent Contractor Classification Matters
Whether you’re hiring full-time staff or freelancers, you need to know how to classify workers to the satisfaction of the IRS – or possibly pay for it later. Conversely, if you’re offered a job but the company insists on paying you as an Independent Contractor, you might be getting the short end of the employment stick. This infographic highlights information that you need to know.
Backin’ Up The Data
How important is it to back up your data? Learn about the numbers behind backing up data in this infographic presented by the team at Acronis.
Britain’s Cleverest Cat
To celebrate the launch of this year’s Britain’s Cleverest Cat competition, Purina’s Felix has created this fun infographic all about other famous cats of the internet.
The Emerging Role of the Pharmacist in the Healthcare Ecosystem
Physicians, insurers, pharmacists and other players in the patient care arena are shifting roles and forming more collaborative, coordinated networks to fill the gaps in care and reduce practice redundancies. This infographic from Parata Systems examines the traditional model of healthcare and how the problems and gaps have created opportunities for pharmacists to leverage technology to fill those gaps.

What it Means to Be an Expert
Do you really know what it means to be an expert? Check out this infographic from the folks at Zintro to learn about what it takes to be an expert at something.
Surprising Alternative Treatments for Mental Disorders
The use of alternative treatments for mental illness is growing in popularity due to concern over the side effects of SSRIs and a general mistrust for pharmaceutical companies. The following infographic describes some of the natural ways people are treating disorders like depression, anxiety and schizophrenia.
Growing or Going? Jobs of the Future
For those entering the workforce, it can be a scary time. It’s hard to know what the future may hold for many industries, but here is an infographic entitled “Growing or Going? Jobs of the Future”, showing you what industries are expected to grow, and which are expected to flop.
The Past and Future of Drones in the U.S.
Drones may seem like material for a science fiction movie, however, drone technology is getting more advanced every day. Criminal Justice Degree Hub has created an infographic entitled “The Past and Future of Drones in the U.S.” giving you a look into the history of drones, how they are used today, and what we might see in the future.
Social Jetlag: No Travel Required
When you think of jetlag, you probably imagine the effects of a flight and travel on the body. However, there is another type of jetlag – social jetlag, which can have even more worrisome effects than its jet setting counterpart. Biz Brain has created an infographic entitled “Social Jetlag: No Travel Required”, explaining what social jetlag is, how to recognize it, and how to avoid it.
Education Spending: Where Are Our Priorities?
When it comes to national spending, the amount allotted to education can be the source of heated debates. The following infographic shows just how much we’re spending, and what it compares to.
Why Employee vs. Independent Contractor Classification Matters
Whether you’re hiring full-time staff or freelancers, you need to know how to classify workers to the satisfaction of the IRS – or possibly pay for it later. Conversely, if you’re offered a job but the company insists on paying you as an Independent Contractor, you might be getting the short end of the employment stick. This infographic highlights information that you need to know.
Backin’ Up The Data
How important is it to back up your data? Learn about the numbers behind backing up data in this infographic presented by the team at Acronis.
Britain’s Cleverest Cat
To celebrate the launch of this year’s Britain’s Cleverest Cat competition, Purina’s Felix has created this fun infographic all about other famous cats of the internet.
The Emerging Role of the Pharmacist in the Healthcare Ecosystem
Physicians, insurers, pharmacists and other players in the patient care arena are shifting roles and forming more collaborative, coordinated networks to fill the gaps in care and reduce practice redundancies. This infographic from Parata Systems examines the traditional model of healthcare and how the problems and gaps have created opportunities for pharmacists to leverage technology to fill those gaps.
What it Means to Be an Expert
Do you really know what it means to be an expert? Check out this infographic from the folks at Zintro to learn about what it takes to be an expert at something.
Surprising Alternative Treatments for Mental Disorders
The use of alternative treatments for mental illness is growing in popularity due to concern over the side effects of SSRIs and a general mistrust for pharmaceutical companies. The following infographic describes some of the natural ways people are treating disorders like depression, anxiety and schizophrenia.
Partners


Browse Archives By Category
Animated Infographics
Business Infographics
Career & Jobs Infographics
Education Infographics
Entertainment Industry Infographics
Environmental Infographics
Finance & Money Infographics
Food & Drink Infographics
Health Infographics
Historical Infographics
Home & Garden Infographics
Internet Infographics
Law and Legal Infographics
Lifestyle Infographics
Marketing Infographics
Offbeat Infographics
Parenting Infographics
Pets & Animals Infographics
Political Infographics
Shopping Infographics
Sports and Athletic Infographics
Technology Infographics
Transportation Infographics
Travel Infographics
Video Infographics