


Search 12,100+ Infographics!
The Insane Facts About Sleep
We all need it and often we crave it but more frequently than not, we don’t get enough of it.We are talking about sleep here and in this infographic, discover 30 insane facts about sleep.
Where Do Blood Diamonds Come From?
Diamonds are a girls best friend, right? But where do these shiny gems come from and what exactly is a “blood diamond?” This infographic takes a look at this ongoing issue.
Connectedness & Health: The Science of Social Connection
We all think we know how to take good are of ourselves: eat your veggies, work out and try try to get enough sleep. But how many of us know that social connection is just as critical? In this infographic, learn the science on how social connection improves physical health and mental and emotional well-being.
The Road-Tripper’s Guide to Southern Barbecue
Taste the best barbecue the south has to offer by following The Road-Tripper’s Guide to Southern Barbecue from Cash Store. Identified in this infographic are the top barbecue joints in southern states, based on ratings and reviews from the best barbecue bloggers and review sites across the web.
The Tablet Race: The iPad vs. the Rest
If you’ve ever held and used a tablet computing device such as the Apple iPad, you probably already know the addictive nature of its touch-based interactions. The iPad, when it launched, was and still is a revolutionary device, improving with each generation, getting lighter, thinner and faster — as well as appealing to adults, teens, and even children as young as one year old. This infographic from BestChoiceReviews.org takes a look at some of the numbers behind the iPad.
Treasures Lost at Sea
You’ve seen the movies, you’ve read the stories, and you’ve dreamed the dreams about finding sunken treasure, but have you ever spent time learning about what hidden gems actually exist at the bottom of the sea? In the following infographic, Self Storage Finders presents a handful of documented and unconfirmed treasures that are currently sitting on the ocean floor just waiting to be scooped up by lucky and relentless treasure hunters.
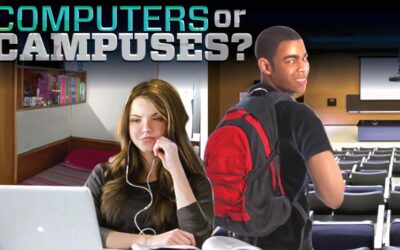
Online Education vs Traditional Education
It’s not surprising that more and more schools are offering degrees earned entirely online, or that more and more university students are enrolling in web-based courses. Considering the upward trend of online schooling, will physical colleges ever be rendered obsolete? Explore this in the following infographic.
Is Augmented Reality The Next Marketing “Killer-App”?
Augmented reality is a digital technology that overlays text, images or video over physical objects. AR provides a way to bridge the gap between the physical and digital experience, empowering brands to better engage with their customers and drive real business results in the process. With meteoric growth and the convergence of social, mobile & context, AR just might be the next marketing “killer-app”.
Victims Have Rights Too
There are core rights that are reserved for victims of crimes. Learn what these rights are in the following infographic.
Affordable Mixology: A Student’s Guide
Are you tired of cocktails that cost as much as a bottle of liquor at home? Check out the following student’s guide to affordable mixology.
The Insane Facts About Sleep
We all need it and often we crave it but more frequently than not, we don’t get enough of it.We are talking about sleep here and in this infographic, discover 30 insane facts about sleep.
Where Do Blood Diamonds Come From?
Diamonds are a girls best friend, right? But where do these shiny gems come from and what exactly is a “blood diamond?” This infographic takes a look at this ongoing issue.
Connectedness & Health: The Science of Social Connection
We all think we know how to take good are of ourselves: eat your veggies, work out and try try to get enough sleep. But how many of us know that social connection is just as critical? In this infographic, learn the science on how social connection improves physical health and mental and emotional well-being.
The Road-Tripper’s Guide to Southern Barbecue
Taste the best barbecue the south has to offer by following The Road-Tripper’s Guide to Southern Barbecue from Cash Store. Identified in this infographic are the top barbecue joints in southern states, based on ratings and reviews from the best barbecue bloggers and review sites across the web.
The Tablet Race: The iPad vs. the Rest
If you’ve ever held and used a tablet computing device such as the Apple iPad, you probably already know the addictive nature of its touch-based interactions. The iPad, when it launched, was and still is a revolutionary device, improving with each generation, getting lighter, thinner and faster — as well as appealing to adults, teens, and even children as young as one year old. This infographic from BestChoiceReviews.org takes a look at some of the numbers behind the iPad.
Treasures Lost at Sea
You’ve seen the movies, you’ve read the stories, and you’ve dreamed the dreams about finding sunken treasure, but have you ever spent time learning about what hidden gems actually exist at the bottom of the sea? In the following infographic, Self Storage Finders presents a handful of documented and unconfirmed treasures that are currently sitting on the ocean floor just waiting to be scooped up by lucky and relentless treasure hunters.
Online Education vs Traditional Education
It’s not surprising that more and more schools are offering degrees earned entirely online, or that more and more university students are enrolling in web-based courses. Considering the upward trend of online schooling, will physical colleges ever be rendered obsolete? Explore this in the following infographic.
Is Augmented Reality The Next Marketing “Killer-App”?
Augmented reality is a digital technology that overlays text, images or video over physical objects. AR provides a way to bridge the gap between the physical and digital experience, empowering brands to better engage with their customers and drive real business results in the process. With meteoric growth and the convergence of social, mobile & context, AR just might be the next marketing “killer-app”.
Victims Have Rights Too
There are core rights that are reserved for victims of crimes. Learn what these rights are in the following infographic.
Affordable Mixology: A Student’s Guide
Are you tired of cocktails that cost as much as a bottle of liquor at home? Check out the following student’s guide to affordable mixology.
Partners


Browse Archives By Category
Animated Infographics
Business Infographics
Career & Jobs Infographics
Education Infographics
Entertainment Industry Infographics
Environmental Infographics
Finance & Money Infographics
Food & Drink Infographics
Health Infographics
Historical Infographics
Home & Garden Infographics
Internet Infographics
Law and Legal Infographics
Lifestyle Infographics
Marketing Infographics
Offbeat Infographics
Parenting Infographics
Pets & Animals Infographics
Political Infographics
Shopping Infographics
Sports and Athletic Infographics
Technology Infographics
Transportation Infographics
Travel Infographics
Video Infographics