


Search 12,100+ Infographics!
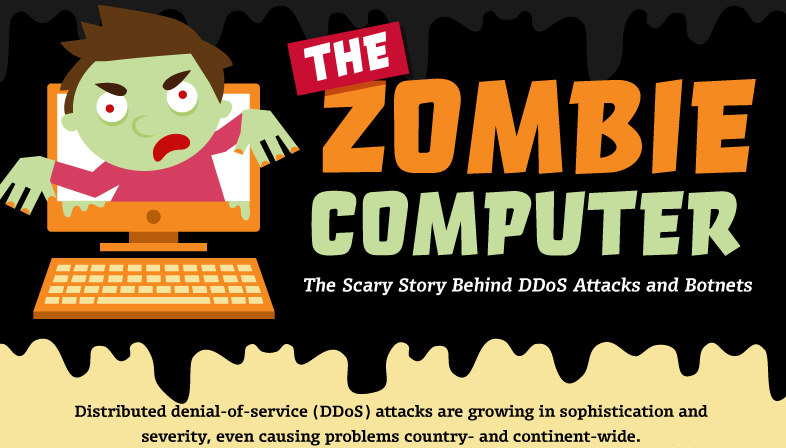
The Zombie Computer
As a business, your up-time is your lifeblood, and stemming the flow of intrusion is vital to keeping your staff and your customers working at full capacity. In this infographic, Bluehost takes a look at how organized networks of “zombie computers” can damage your IT infrastructure, and how to select the right webhost to keep your network safe.
The Real Cost of Customer Service
Anyone in business knows that customer service is key, but what is the real cost of bad customer service? Check out the following infographic below by ClickSoftware to learn the answer to this question and more.
Rise of The Video Empire
According to recent research, the average Internet user is likely to watch roughly 206 videos each month. Based on that statistic, it may not surprise you to read that almost seventy percent of marketers now incorporate video into their marketing campaigns. In the following infographic, Wyzowl makes the case for video and including information that will convince you of how important developing and sharing video is to your overall content marketing efforts online.

Is the U.S. Finally Getting Smart About Payment Technology?
After a recent spike in credit card theft in the United States, Congress is abandoning unsecure traditional payment methods for “smart card” technology. Although these more advanced credit cards may be new to the United States, they have existed in other international markets for more than twenty years!
Informatics: Combining Nursing Skills with Information Technology
Nursing informatics is a rapidly growing sector of the healthcare industry. To learn more about this subject, check out the following infographic presented by NursingSchoolHub.com.
The Secrets of Body Language
93% of what we communicate is non-verbal, while gestures make up only 55%, our voice 38% and words a merely 7%. At work, at home, at play, famous, or infamous, your body language tells the world all about you. A majority of what we communicate is through gestures and how we physically position our bodies. Check out the following infographic for a guide on body gesture and what each mean.

Why Women Don’t Make Less than Men
The claim that women make 77 cents to every dollar men make disregards many choices women make, leading to false claims on social inequality and skewing gender debates. In this infographic, TopManagementDegrees.com explores why women don’t REALLY make less than men.
How B2B Businesses Are Tackling Social Media in 2014
Although it may seem counter-intuitive to many, B2B is close on the heels of B2C in embracing social media marketing. B2B marketers are known to be data crunchers and analysts first, and since the figures for social media in 2013 are by no means disappointing, sales teams and marketing managers are taking on the role of social “amplifiers” for their firms.
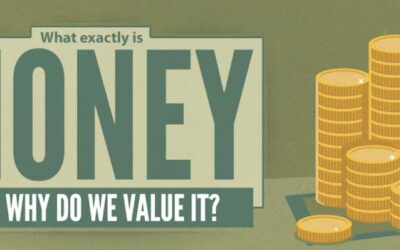
What Exactly is Money and Why Do We Value It?
Have you ever thought about where money comes from and why it is so valuable? Check out the following infographic presented to learn about the history of money and why we value it.
Counting the Cost of Fish & Chips
Over the years, the cost of fish & chips has increased by 1220%. Starting its journey costing only 25p in 1970 one of the most well known and loved take-aways in the UK now costs around £3.30. It seems the cost of fish & chips is one of the most overlooked casualties of inflation.
The Zombie Computer
As a business, your up-time is your lifeblood, and stemming the flow of intrusion is vital to keeping your staff and your customers working at full capacity. In this infographic, Bluehost takes a look at how organized networks of “zombie computers” can damage your IT infrastructure, and how to select the right webhost to keep your network safe.
The Real Cost of Customer Service
Anyone in business knows that customer service is key, but what is the real cost of bad customer service? Check out the following infographic below by ClickSoftware to learn the answer to this question and more.
Rise of The Video Empire
According to recent research, the average Internet user is likely to watch roughly 206 videos each month. Based on that statistic, it may not surprise you to read that almost seventy percent of marketers now incorporate video into their marketing campaigns. In the following infographic, Wyzowl makes the case for video and including information that will convince you of how important developing and sharing video is to your overall content marketing efforts online.
Is the U.S. Finally Getting Smart About Payment Technology?
After a recent spike in credit card theft in the United States, Congress is abandoning unsecure traditional payment methods for “smart card” technology. Although these more advanced credit cards may be new to the United States, they have existed in other international markets for more than twenty years!
Informatics: Combining Nursing Skills with Information Technology
Nursing informatics is a rapidly growing sector of the healthcare industry. To learn more about this subject, check out the following infographic presented by NursingSchoolHub.com.
The Secrets of Body Language
93% of what we communicate is non-verbal, while gestures make up only 55%, our voice 38% and words a merely 7%. At work, at home, at play, famous, or infamous, your body language tells the world all about you. A majority of what we communicate is through gestures and how we physically position our bodies. Check out the following infographic for a guide on body gesture and what each mean.
Why Women Don’t Make Less than Men
The claim that women make 77 cents to every dollar men make disregards many choices women make, leading to false claims on social inequality and skewing gender debates. In this infographic, TopManagementDegrees.com explores why women don’t REALLY make less than men.
How B2B Businesses Are Tackling Social Media in 2014
Although it may seem counter-intuitive to many, B2B is close on the heels of B2C in embracing social media marketing. B2B marketers are known to be data crunchers and analysts first, and since the figures for social media in 2013 are by no means disappointing, sales teams and marketing managers are taking on the role of social “amplifiers” for their firms.
What Exactly is Money and Why Do We Value It?
Have you ever thought about where money comes from and why it is so valuable? Check out the following infographic presented to learn about the history of money and why we value it.
Counting the Cost of Fish & Chips
Over the years, the cost of fish & chips has increased by 1220%. Starting its journey costing only 25p in 1970 one of the most well known and loved take-aways in the UK now costs around £3.30. It seems the cost of fish & chips is one of the most overlooked casualties of inflation.
Partners


Browse Archives By Category
Animated Infographics
Business Infographics
Career & Jobs Infographics
Education Infographics
Entertainment Industry Infographics
Environmental Infographics
Finance & Money Infographics
Food & Drink Infographics
Health Infographics
Historical Infographics
Home & Garden Infographics
Internet Infographics
Law and Legal Infographics
Lifestyle Infographics
Marketing Infographics
Offbeat Infographics
Parenting Infographics
Pets & Animals Infographics
Political Infographics
Shopping Infographics
Sports and Athletic Infographics
Technology Infographics
Transportation Infographics
Travel Infographics
Video Infographics