


Search 12,100+ Infographics!
South by Southwest on Twitter
Austin’s South by Southwest finished up recently. The folks at MediaMiser tracked #SXSW over the course of the week to see who and what was influencing the conversation at the festival.

Green Zone
From recycling paper to offices using wind power, our workplaces are adopting more green technologies every day. Here is an infographic entitled “Green Zone”, detailing how companies around the nation are starting to put green technology into place in the workplace, and just what a booming industry it is.
Obamacare by the Numbers
In the following infographic by Healthcare-Administration-Degree.net, take a look at the numbers of Americans who have applied for health insurance since Obamacare has become law. You will also learn about glitches that occurred on the website.

Silent Killers of Your Metabolism
Your metabolism is responsible for turning calories into energy. A slow metabolism can lead to a build-up of calories, stored as fat for later use. Ultimately, this leads to unwanted weight gain and, if unchecked, obesity. In the following infographic, discover a number of factors that are wreaking havoc on your metabolism.

Top 10 Tax Mistakes Traders Make
The online trading academy has created a list of mistakes that most investors and traders make when they file their taxes. When filing their taxes they always have special challenges that they are faced with and these mistakes are common. View the infographic below to learn the top 10 mistakes you as an investor or trader need to be aware of.

How to Keep Your Eyes Healthy at Work
Many of us stare at computer screens all day long at work and that’s on top of staring at smartphones, tablets and televisions at home. In fact, you’re staring at a screen right now! It has an awful impact on our vision. Do you know how to prevent this damage?
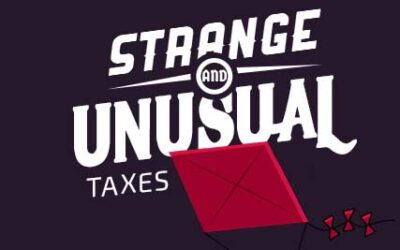
Weird, Unusual Taxes We Have Had Throughout History
efile.com has created an infographic showing some of the weird and unusual taxes we have had over the years. Even though we know it’s certainly not unusual to be taxed, we all know there has been some crazy taxes that they have come up throughout the years.
Evolution of Logos
Branding and brand image is such a hot topic in the marketing world today. Branding and logo deign is a continuously evolving process that has to adapt to cultural shifts. This infographic takes its readers through the logo and branding history of some of today’s largest companies.

Our Weird Planet According to Google
When Google Earth first came onto the scene, users had mixed feelings regarding its detailed nature. Once Googlers got used to the software, they started exploring, and came across an amazing array of incredible sights. Here’s an infographic highlighting some of the most incredible sights Google Earth users have found.
How to Grow Your Email, Mobile, & Social Audiences
Getting an honest-to-goodness active social following can be tough. Pardot has created an infographic entitled “How to Grow Your Email, Mobile, and Social Audiences”, detailing the results of the Subscribers, Fans and Followers research series, giving you tips and tricks on how to get the most bang for your buck when it comes to social media.
South by Southwest on Twitter
Austin’s South by Southwest finished up recently. The folks at MediaMiser tracked #SXSW over the course of the week to see who and what was influencing the conversation at the festival.
Green Zone
From recycling paper to offices using wind power, our workplaces are adopting more green technologies every day. Here is an infographic entitled “Green Zone”, detailing how companies around the nation are starting to put green technology into place in the workplace, and just what a booming industry it is.
Obamacare by the Numbers
In the following infographic by Healthcare-Administration-Degree.net, take a look at the numbers of Americans who have applied for health insurance since Obamacare has become law. You will also learn about glitches that occurred on the website.
Silent Killers of Your Metabolism
Your metabolism is responsible for turning calories into energy. A slow metabolism can lead to a build-up of calories, stored as fat for later use. Ultimately, this leads to unwanted weight gain and, if unchecked, obesity. In the following infographic, discover a number of factors that are wreaking havoc on your metabolism.
Top 10 Tax Mistakes Traders Make
The online trading academy has created a list of mistakes that most investors and traders make when they file their taxes. When filing their taxes they always have special challenges that they are faced with and these mistakes are common. View the infographic below to learn the top 10 mistakes you as an investor or trader need to be aware of.
How to Keep Your Eyes Healthy at Work
Many of us stare at computer screens all day long at work and that’s on top of staring at smartphones, tablets and televisions at home. In fact, you’re staring at a screen right now! It has an awful impact on our vision. Do you know how to prevent this damage?
Weird, Unusual Taxes We Have Had Throughout History
efile.com has created an infographic showing some of the weird and unusual taxes we have had over the years. Even though we know it’s certainly not unusual to be taxed, we all know there has been some crazy taxes that they have come up throughout the years.
Evolution of Logos
Branding and brand image is such a hot topic in the marketing world today. Branding and logo deign is a continuously evolving process that has to adapt to cultural shifts. This infographic takes its readers through the logo and branding history of some of today’s largest companies.
Our Weird Planet According to Google
When Google Earth first came onto the scene, users had mixed feelings regarding its detailed nature. Once Googlers got used to the software, they started exploring, and came across an amazing array of incredible sights. Here’s an infographic highlighting some of the most incredible sights Google Earth users have found.
How to Grow Your Email, Mobile, & Social Audiences
Getting an honest-to-goodness active social following can be tough. Pardot has created an infographic entitled “How to Grow Your Email, Mobile, and Social Audiences”, detailing the results of the Subscribers, Fans and Followers research series, giving you tips and tricks on how to get the most bang for your buck when it comes to social media.
Partners


Browse Archives By Category
Animated Infographics
Business Infographics
Career & Jobs Infographics
Education Infographics
Entertainment Industry Infographics
Environmental Infographics
Finance & Money Infographics
Food & Drink Infographics
Health Infographics
Historical Infographics
Home & Garden Infographics
Internet Infographics
Law and Legal Infographics
Lifestyle Infographics
Marketing Infographics
Offbeat Infographics
Parenting Infographics
Pets & Animals Infographics
Political Infographics
Shopping Infographics
Sports and Athletic Infographics
Technology Infographics
Transportation Infographics
Travel Infographics
Video Infographics