


Search 12,100+ Infographics!

If Everything Rose Like House Prices
Prices of many small items have increased drastically in past few years and are still going on. Discover more about the prices in this infographic by Ocean Finance & Mortgages.
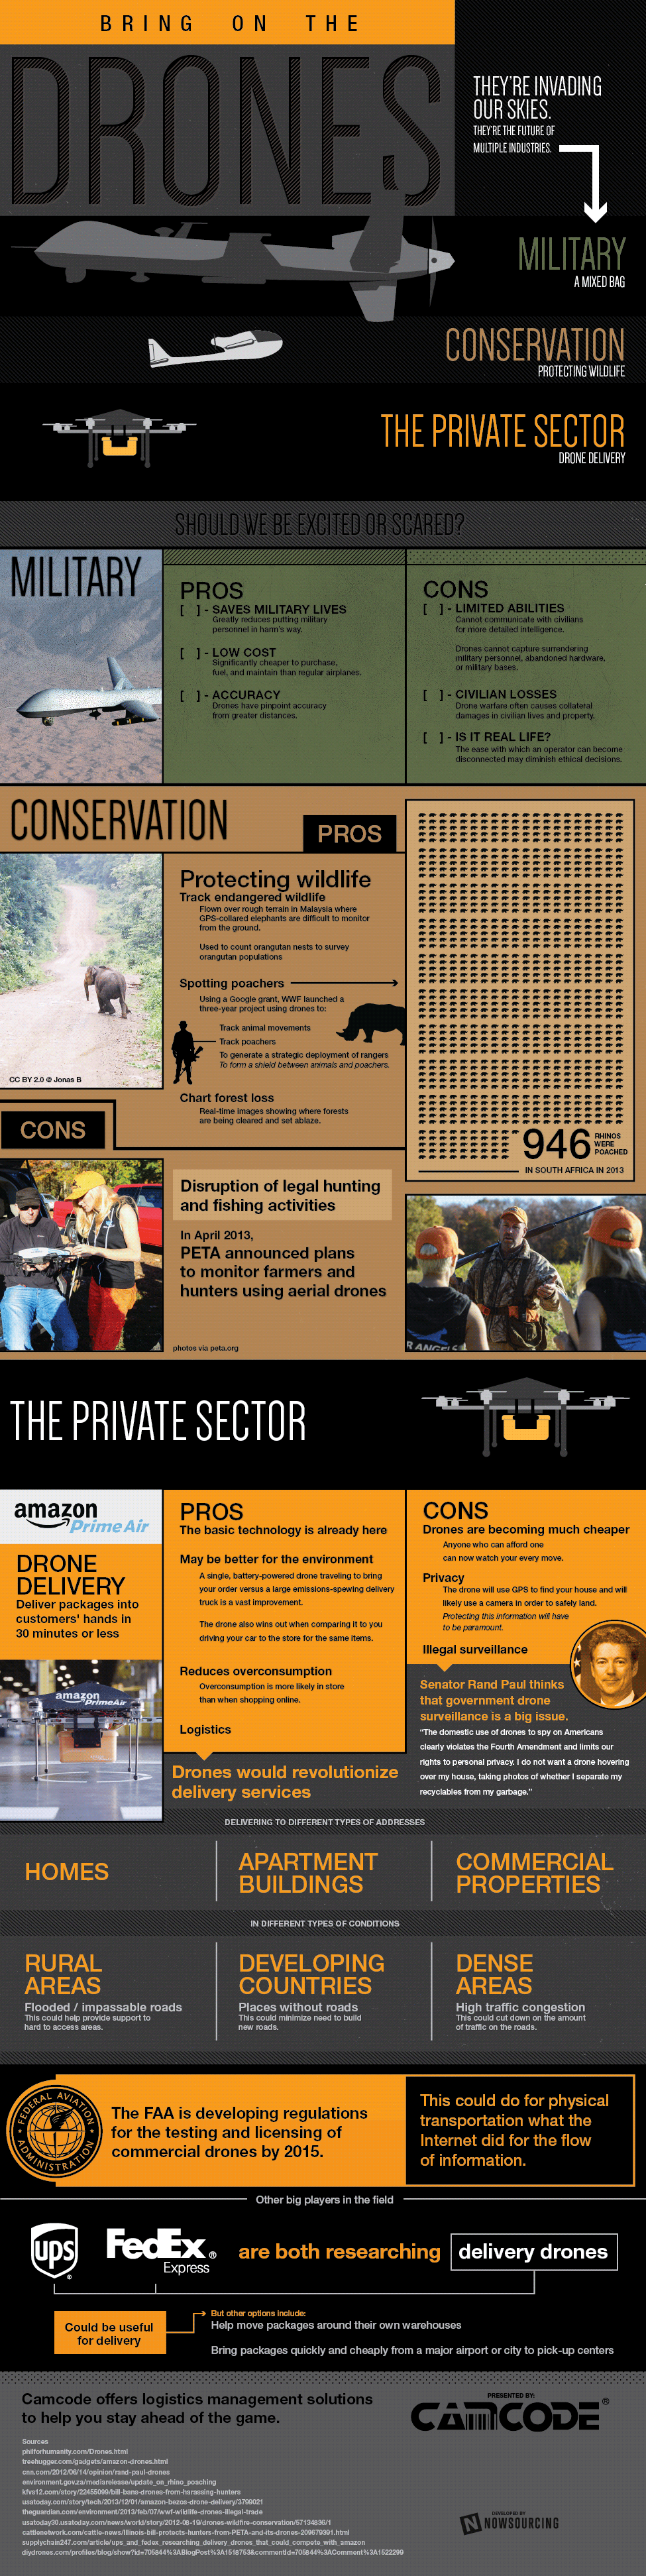
Bring on the Drones
Drones are everywhere nowadays, and it’s not just the military that’s using them. Check out the following infographic by Camcode to learn more about drones and how they are being used.
About The Sell House Fast Process
There are many reasons why people need to sell their house fast and the process can be quite daunting and/or confusing. There are also many options that available that a lot of people are not aware of. Because of this, here is an infographic that should give you a good understanding about the sell house fast process and how it works.
The End of TV?
The cable TV business has had its worst year in 2013. Are families ready to ditch the box? Here is an infographic entitled “The End of TV” detailing how families are spending their TV viewing hours.
The New Parents’ Guide to Mobile Photography
Every parent likes to document their childrens’ lives through photos. And with all the different apps out there it’s pretty easy to take quality pictures. Check out this infographic to learn how you can take the best pictures possible.
Parents’ Complete Guide to Baby Food
Baby on the way? Got one on your hip right now? Check out this new parent must-read: “The Complete Guide to Baby Food.” This guide will ensure you’re feeding your baby nutritious food and it can help you save money along the way.
Daylight Saving Time: A Historical & Pratical Guide
March 9th is daylight saving time! Here are 12 facts about daylight saving time (one for every hour) that will help you get ready for the big “spring forward” and learn the history behind changing our clocks.
Living In Storage
For this project, Self Storage Finders takes a look at how innovative thinkers around the world are using some of the 300 million shipping containers that currently sit empty and unused. While most people think of obvious solutions like recycling the raw materials, a few architects have used these storage containers to construct modern buildings.
What if Downton Abbey Had SmartThings?
What if Downton Abbey was a smart home? How would wifi, phones, texts and smart technology devices change the lives of the nobility and servants? Find out with this infographic.
Cooking Tricks You Won’t Believe
Cooking doesn’t always have to be “by the book.” What about that friend who refuses to adhere to recipes when cooking? Or the mom who insists that every family recipe is perfected with “a little bit of this and a little bit of that?” Maybe you’re just bored with your kitchen routine and want a new way to play in the kitchen?
If Everything Rose Like House Prices
Prices of many small items have increased drastically in past few years and are still going on. Discover more about the prices in this infographic by Ocean Finance & Mortgages.
Bring on the Drones
Drones are everywhere nowadays, and it’s not just the military that’s using them. Check out the following infographic by Camcode to learn more about drones and how they are being used.
About The Sell House Fast Process
There are many reasons why people need to sell their house fast and the process can be quite daunting and/or confusing. There are also many options that available that a lot of people are not aware of. Because of this, here is an infographic that should give you a good understanding about the sell house fast process and how it works.
The End of TV?
The cable TV business has had its worst year in 2013. Are families ready to ditch the box? Here is an infographic entitled “The End of TV” detailing how families are spending their TV viewing hours.
The New Parents’ Guide to Mobile Photography
Every parent likes to document their childrens’ lives through photos. And with all the different apps out there it’s pretty easy to take quality pictures. Check out this infographic to learn how you can take the best pictures possible.
Parents’ Complete Guide to Baby Food
Baby on the way? Got one on your hip right now? Check out this new parent must-read: “The Complete Guide to Baby Food.” This guide will ensure you’re feeding your baby nutritious food and it can help you save money along the way.
Daylight Saving Time: A Historical & Pratical Guide
March 9th is daylight saving time! Here are 12 facts about daylight saving time (one for every hour) that will help you get ready for the big “spring forward” and learn the history behind changing our clocks.
Living In Storage
For this project, Self Storage Finders takes a look at how innovative thinkers around the world are using some of the 300 million shipping containers that currently sit empty and unused. While most people think of obvious solutions like recycling the raw materials, a few architects have used these storage containers to construct modern buildings.
What if Downton Abbey Had SmartThings?
What if Downton Abbey was a smart home? How would wifi, phones, texts and smart technology devices change the lives of the nobility and servants? Find out with this infographic.
Cooking Tricks You Won’t Believe
Cooking doesn’t always have to be “by the book.” What about that friend who refuses to adhere to recipes when cooking? Or the mom who insists that every family recipe is perfected with “a little bit of this and a little bit of that?” Maybe you’re just bored with your kitchen routine and want a new way to play in the kitchen?
Partners


Browse Archives By Category
Animated Infographics
Business Infographics
Career & Jobs Infographics
Education Infographics
Entertainment Industry Infographics
Environmental Infographics
Finance & Money Infographics
Food & Drink Infographics
Health Infographics
Historical Infographics
Home & Garden Infographics
Internet Infographics
Law and Legal Infographics
Lifestyle Infographics
Marketing Infographics
Offbeat Infographics
Parenting Infographics
Pets & Animals Infographics
Political Infographics
Shopping Infographics
Sports and Athletic Infographics
Technology Infographics
Transportation Infographics
Travel Infographics
Video Infographics