


Search 12,100+ Infographics!

A Guide To Selecting the Best Prescription Lenses for Your Needs
According to statistics from recent years, almost 75% of the adult population of the world needs some kind of corrective eyewear in order to properly see. From reading glasses to goggle worn while playing sports, there are many reasons why you might need to wear such an accessory. Marveloptics has put together the following visual guide to selecting the best prescription lenses for your needs.
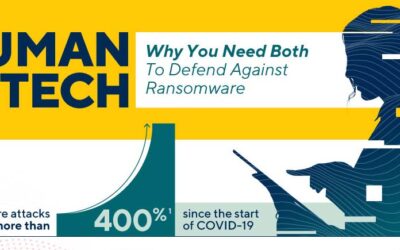
Humans and Tech to Stop Ransomware
Ransomware attacks are getting more sophisticated by the day. To combat such cyber threats, you’ll need to strike the right balance of cyber security professionals and the technologies to support them. Learn how humans and tech work together to Stop ransomware in the following infographic.
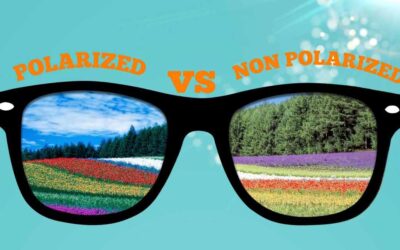
Everything To Know About Polarized vs Non-Polarized Sunglasses
Polarization is a treatment that can be used in a number of scenarios. If you’re unsure of whether or not polarized sunglasses are the right fit for your lifestyle, look over this guide from Marveloptics and discover everything about polarization.
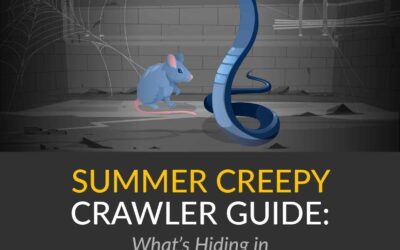
Summer Creepy Crawler Guide: What’s Hiding in My Home’s Crawl Space?
What better time than summer to get outside and have fun adventures with your friends and family? One thing to keep in mind as you’re opening up the windows and doors in your home for summertime is that you’ll need to be wary of rising humidity and insects. Groundworks has put together this “Summer Creepy Crawler Guide” so you learn what’s hiding in my home’s crawl space.
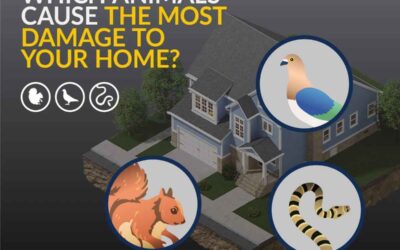
Which Animals Cause the Most Damage to Your Home?
An animal can cause lasting damage to your home and foundation. It can chew up electrical wiring inside your walls, destroy ducts, or damage critical drainage systems. On top of this, wild animals and rodents are frequently carriers of disease and could pose serious health risks. Even so, your home does not have the same level of risk from every type of animal. Which animals can cause the most damage to your home or foundation?

How the Pandemic Changed Breakfast
Remote work may have changed the way we work, but how about our other daily habits? Take a look a how the COVID pandemic has changed the way we eat breakfast with this study and infographic courtesy of Bob Evans.

CAC: Why It’s Important and How to Lower It
Customer acquisition cost (CAC) is the amount of money a company spends to get a new customer and it helps measure the return on investment of efforts to grow their clientele. Customer acquisition expenses are a good predictor of future performance for your firm. The following infographic reveals five different ways to enhance your CAC today.

Bariatric Surgery: What’s New
Obesity is associated with several health-related risks and consequences. This can ultimately result in a reduced quality of life and an earlier death. However, studies have shown that patients who lose weight following bariatric surgery can significantly reduce their risk of obesity related health issues.
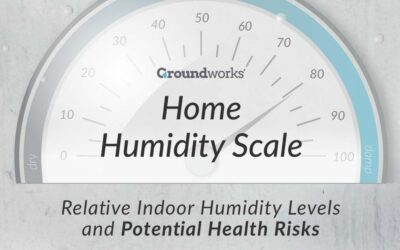
How To Create a Comfortable Home Humidity Scale
When it comes to your home, Relative humidity (RH) levels can play a major role in your health. While humidity is the amount of water content in the air, relative humidity is when moisture in the air is relative to the temperature. RH is expressed as a percentage of the total amount of moisture the air can hold.
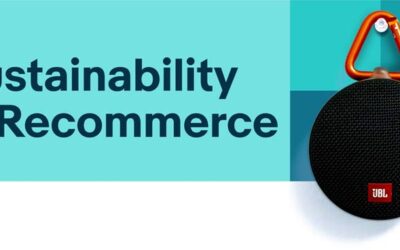
The Key to Sustainable Commerce
As consumers, we have choices in the world of who we buy from online. That is why the rise of sustainable commerce is so important. Learn more about the key to sustainable commerce in this infographic from eBay.
A Guide To Selecting the Best Prescription Lenses for Your Needs
According to statistics from recent years, almost 75% of the adult population of the world needs some kind of corrective eyewear in order to properly see. From reading glasses to goggle worn while playing sports, there are many reasons why you might need to wear such an accessory. Marveloptics has put together the following visual guide to selecting the best prescription lenses for your needs.
Humans and Tech to Stop Ransomware
Ransomware attacks are getting more sophisticated by the day. To combat such cyber threats, you’ll need to strike the right balance of cyber security professionals and the technologies to support them. Learn how humans and tech work together to Stop ransomware in the following infographic.
Everything To Know About Polarized vs Non-Polarized Sunglasses
Polarization is a treatment that can be used in a number of scenarios. If you’re unsure of whether or not polarized sunglasses are the right fit for your lifestyle, look over this guide from Marveloptics and discover everything about polarization.
Summer Creepy Crawler Guide: What’s Hiding in My Home’s Crawl Space?
What better time than summer to get outside and have fun adventures with your friends and family? One thing to keep in mind as you’re opening up the windows and doors in your home for summertime is that you’ll need to be wary of rising humidity and insects. Groundworks has put together this “Summer Creepy Crawler Guide” so you learn what’s hiding in my home’s crawl space.
Which Animals Cause the Most Damage to Your Home?
An animal can cause lasting damage to your home and foundation. It can chew up electrical wiring inside your walls, destroy ducts, or damage critical drainage systems. On top of this, wild animals and rodents are frequently carriers of disease and could pose serious health risks. Even so, your home does not have the same level of risk from every type of animal. Which animals can cause the most damage to your home or foundation?
How the Pandemic Changed Breakfast
Remote work may have changed the way we work, but how about our other daily habits? Take a look a how the COVID pandemic has changed the way we eat breakfast with this study and infographic courtesy of Bob Evans.
CAC: Why It’s Important and How to Lower It
Customer acquisition cost (CAC) is the amount of money a company spends to get a new customer and it helps measure the return on investment of efforts to grow their clientele. Customer acquisition expenses are a good predictor of future performance for your firm. The following infographic reveals five different ways to enhance your CAC today.
Bariatric Surgery: What’s New
Obesity is associated with several health-related risks and consequences. This can ultimately result in a reduced quality of life and an earlier death. However, studies have shown that patients who lose weight following bariatric surgery can significantly reduce their risk of obesity related health issues.
How To Create a Comfortable Home Humidity Scale
When it comes to your home, Relative humidity (RH) levels can play a major role in your health. While humidity is the amount of water content in the air, relative humidity is when moisture in the air is relative to the temperature. RH is expressed as a percentage of the total amount of moisture the air can hold.
The Key to Sustainable Commerce
As consumers, we have choices in the world of who we buy from online. That is why the rise of sustainable commerce is so important. Learn more about the key to sustainable commerce in this infographic from eBay.
Partners


Browse Archives By Category
Animated Infographics
Business Infographics
Career & Jobs Infographics
Education Infographics
Entertainment Industry Infographics
Environmental Infographics
Finance & Money Infographics
Food & Drink Infographics
Health Infographics
Historical Infographics
Home & Garden Infographics
Internet Infographics
Law and Legal Infographics
Lifestyle Infographics
Marketing Infographics
Offbeat Infographics
Parenting Infographics
Pets & Animals Infographics
Political Infographics
Shopping Infographics
Sports and Athletic Infographics
Technology Infographics
Transportation Infographics
Travel Infographics
Video Infographics