


Search 12,100+ Infographics!

Self-Employed Retirement Savings Habits
While the traditionally employed are being enrolled in company-sponsored 401(k)s with regular automatic contributions, nearly 70 percent of self-employed are often not saving for retirement on a regular basis – or at all – according to this survey of self-employed Americans.

2014 Interior Design Trends
According to this infographic, the 2014 home has certain buzzwords and and rules of thumb. If you want a handy guide on which colors, patterns, textures, use of space, and the kind of appliances and decor to go for, this would be it.
Bramall Lane – The Oldest Football Stadium in the World
Founded over 150 years ago, Sheffield United’s Bramall Lane is a pitch with plenty of history. Take a look at how one of the world’s oldest football stadiums has grown through the years in the following infographic.
9 SEO Experts on the Future of Marketing
Marketing is a twisted, winding road, with many dead ends. Website content, along with social network marketing, are two ways to ensure that you stay in tune with your customers. As soon as search engine optimization (SEO) is mentioned, however, many marketers run the other direction. With so much mis-information out there about SEO, what do you believe?
App Optimization for iOS 7
App Optimization for iOS 7, which has been specially designed for iOS app developers. It offers insights on the new features and tools available in Apple’s latest OS, and encourages app developers (who have not yet made the iOS 7 leap) to move their apps forward to avoid providing users with an outdated app experience.

Americans at Work: The Best and Worst Jobs
Most Americans spend more time on the job than they do on anything else. In fact, the average employee spends more than 2/3 of his or her day at work or on work-related activities. That’s more time than we spend sleeping or raising our children. This infographic looks at Americans at work.
Will Drivers Licenses Be Needed In The Future
Thanks to advances in technology, everyday tasks continue to get easier and easier for society. For many, the idea of self-driving cars seems like a technology that would only be available to the general public in the far distant future. In recent years however, a handful of companies have been making investments to make this seemingly unimaginable innovation possible.

Wine 101: Fun Facts to Impress Your Friends
This infographic features interesting wine facts and little-known statistics that will definitely get the conversation started at your next party. For instance, did you know that there are 10,000 varieties of wine grapes worldwide? Also, the average age of a French Oak Tree harvested for use in creating wine barrels is 170 years old?

How Women Improve the Global Economy
There’s compelling evidence that women contribute to global prosperity. Explore successes, challenges and possibilities as women “Lean In” to the global economy. Although women add economic value to technology and entrepreneurship and lead some of the world’s largest companies, challenges remain. What can be done?
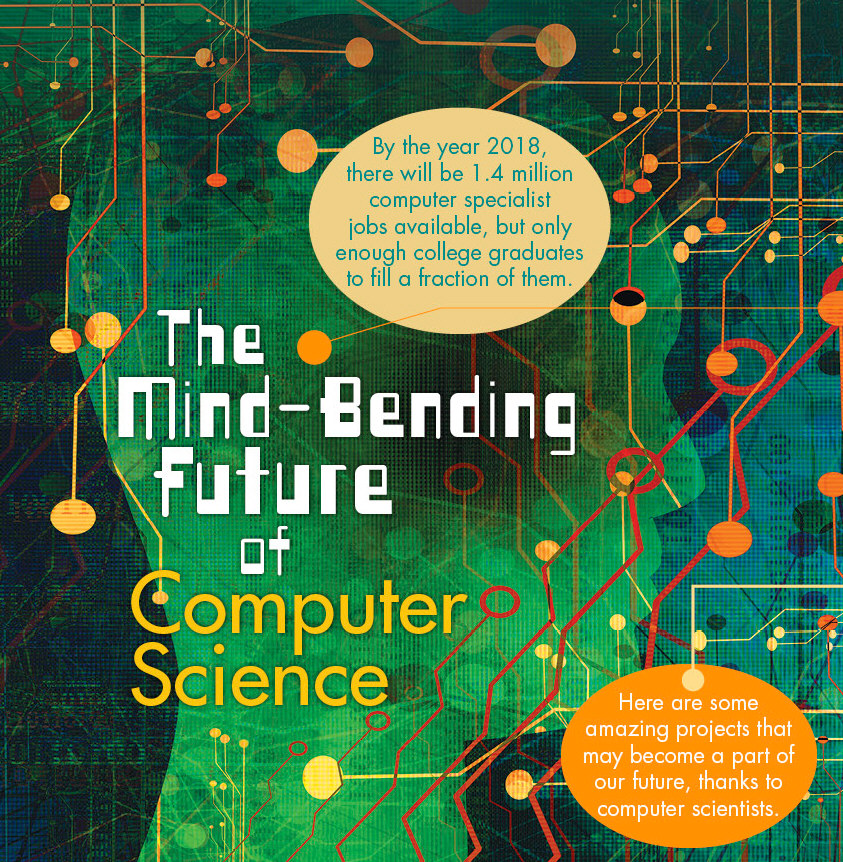
The Mind-Bending Future of Computer Science
By the year 2018, there will be 1.4 million computer specialist jobs available, but only enough college graduates to fill a fraction of them. In this infographic, discover some amazing projects that may become a part of our future, thanks to computer scientists.
Self-Employed Retirement Savings Habits
While the traditionally employed are being enrolled in company-sponsored 401(k)s with regular automatic contributions, nearly 70 percent of self-employed are often not saving for retirement on a regular basis – or at all – according to this survey of self-employed Americans.
2014 Interior Design Trends
According to this infographic, the 2014 home has certain buzzwords and and rules of thumb. If you want a handy guide on which colors, patterns, textures, use of space, and the kind of appliances and decor to go for, this would be it.
Bramall Lane – The Oldest Football Stadium in the World
Founded over 150 years ago, Sheffield United’s Bramall Lane is a pitch with plenty of history. Take a look at how one of the world’s oldest football stadiums has grown through the years in the following infographic.
9 SEO Experts on the Future of Marketing
Marketing is a twisted, winding road, with many dead ends. Website content, along with social network marketing, are two ways to ensure that you stay in tune with your customers. As soon as search engine optimization (SEO) is mentioned, however, many marketers run the other direction. With so much mis-information out there about SEO, what do you believe?
App Optimization for iOS 7
App Optimization for iOS 7, which has been specially designed for iOS app developers. It offers insights on the new features and tools available in Apple’s latest OS, and encourages app developers (who have not yet made the iOS 7 leap) to move their apps forward to avoid providing users with an outdated app experience.
Americans at Work: The Best and Worst Jobs
Most Americans spend more time on the job than they do on anything else. In fact, the average employee spends more than 2/3 of his or her day at work or on work-related activities. That’s more time than we spend sleeping or raising our children. This infographic looks at Americans at work.
Will Drivers Licenses Be Needed In The Future
Thanks to advances in technology, everyday tasks continue to get easier and easier for society. For many, the idea of self-driving cars seems like a technology that would only be available to the general public in the far distant future. In recent years however, a handful of companies have been making investments to make this seemingly unimaginable innovation possible.
Wine 101: Fun Facts to Impress Your Friends
This infographic features interesting wine facts and little-known statistics that will definitely get the conversation started at your next party. For instance, did you know that there are 10,000 varieties of wine grapes worldwide? Also, the average age of a French Oak Tree harvested for use in creating wine barrels is 170 years old?
How Women Improve the Global Economy
There’s compelling evidence that women contribute to global prosperity. Explore successes, challenges and possibilities as women “Lean In” to the global economy. Although women add economic value to technology and entrepreneurship and lead some of the world’s largest companies, challenges remain. What can be done?
The Mind-Bending Future of Computer Science
By the year 2018, there will be 1.4 million computer specialist jobs available, but only enough college graduates to fill a fraction of them. In this infographic, discover some amazing projects that may become a part of our future, thanks to computer scientists.
Partners


Browse Archives By Category
Animated Infographics
Business Infographics
Career & Jobs Infographics
Education Infographics
Entertainment Industry Infographics
Environmental Infographics
Finance & Money Infographics
Food & Drink Infographics
Health Infographics
Historical Infographics
Home & Garden Infographics
Internet Infographics
Law and Legal Infographics
Lifestyle Infographics
Marketing Infographics
Offbeat Infographics
Parenting Infographics
Pets & Animals Infographics
Political Infographics
Shopping Infographics
Sports and Athletic Infographics
Technology Infographics
Transportation Infographics
Travel Infographics
Video Infographics