


Search 12,100+ Infographics!
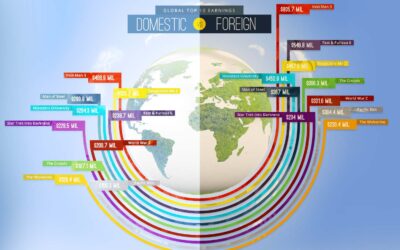
2013 Top Summer Movies
Dish Systems has put together the following infographic that includes some pretty interesting stats in this on top grossing summer movies. For example, the opening weekend of Iron Man 3 generated $174.2, while The Great Gatsby generated $50.1. Disney’s Lone Ranger also fell $126.6 under budget.

5 Types of Workers at High-Risk for Workplace Violence
The following infographic is based on the findings in the Workplace violence and Harassment prevention guide. It also examines Canadian employer’s legal obligation with respect to workplace violence and harassment from the perspective of occupational health and safety. The guide contains practical in-depth advice for developing policies and procedures for an effective workplace violence and harassment prevention program.
Anatomy Of The Microscope
In this infographic from Microscope.com, discover a variety of fun microscope facts, a few relevant literary quotes and a visual timeline of the evolution of microscopy.
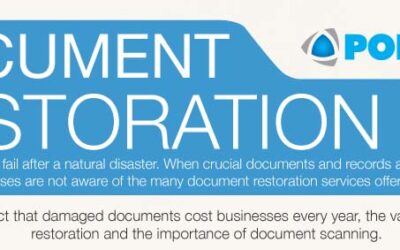
Document Restoration 101
This infographic from Polygon illustrates several types of document restoration processes that are used to salvage water, fire and mold damaged records. Businesses should be sure to have a professional disaster restoration company on hand, as water damaged documents need to be dealt with as soon as possible for optimal results.
Understanding Prostate Cancer
Over 200,000 men are diagnosed with prostate cancer each year. Check out the infographic below to learn more about the startling numbers behind prostate cancer.

Apps vs. Cable: Is Traditional Cable Still Worth It?
With the average price of cable television hitting an average of $86 a month and climbing at 6% per year to an anticipated $200 per month by 2020, is the cost of traditional cable still worth it? Add to this argument that there are an abundant supply of “cable alternatives” and one has to wonder just how long cable providers can continue to survive.

Entrepreneur U: Schools for Start Ups
Still wondering if entrepreneurship is it for You? Check out the following infographic to find out what are the tips and tricks which includes 10 signs you might be an entrepreneur.
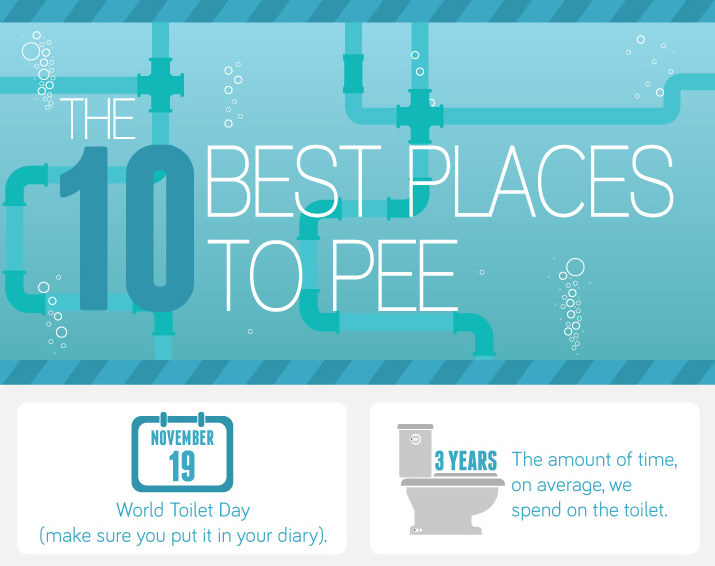
The 10 Best Places To Pee
The average person spends 3 years on the toilet. Seems like a long time to be spent in dull surroundings, doesn’t it? Fear not though! BetterBathrooms.com has put together this handy infographic on the 10 best places to pee and just in time for “World Toilet Day” which is today. So whether your in a bathroom ,6000 feet above ground level, or surrounded by 80,000 fresh violets, going to the loo will never be boring again.
Evolution of Nexus Devices
Google’s first Nexus phone started out as a developer device, but through the years the lineup became more and more popular with the end-user market as well. Last year’s Nexus devices produced great sales figures, and the new generation is even more promising. To celebrate the arrival of the Nexus 5, this infographic shows the evolution of Google’s Nexus phones, from the beginning to the brand new handset.
War Against the Homeless
This infographic includes exhaustive data about homelessness including states accounting for nearly half the homeless population, states having the highest rates of unsheltered homeless and more.
2013 Top Summer Movies
Dish Systems has put together the following infographic that includes some pretty interesting stats in this on top grossing summer movies. For example, the opening weekend of Iron Man 3 generated $174.2, while The Great Gatsby generated $50.1. Disney’s Lone Ranger also fell $126.6 under budget.
5 Types of Workers at High-Risk for Workplace Violence
The following infographic is based on the findings in the Workplace violence and Harassment prevention guide. It also examines Canadian employer’s legal obligation with respect to workplace violence and harassment from the perspective of occupational health and safety. The guide contains practical in-depth advice for developing policies and procedures for an effective workplace violence and harassment prevention program.
Anatomy Of The Microscope
In this infographic from Microscope.com, discover a variety of fun microscope facts, a few relevant literary quotes and a visual timeline of the evolution of microscopy.
Document Restoration 101
This infographic from Polygon illustrates several types of document restoration processes that are used to salvage water, fire and mold damaged records. Businesses should be sure to have a professional disaster restoration company on hand, as water damaged documents need to be dealt with as soon as possible for optimal results.
Understanding Prostate Cancer
Over 200,000 men are diagnosed with prostate cancer each year. Check out the infographic below to learn more about the startling numbers behind prostate cancer.
Apps vs. Cable: Is Traditional Cable Still Worth It?
With the average price of cable television hitting an average of $86 a month and climbing at 6% per year to an anticipated $200 per month by 2020, is the cost of traditional cable still worth it? Add to this argument that there are an abundant supply of “cable alternatives” and one has to wonder just how long cable providers can continue to survive.
Entrepreneur U: Schools for Start Ups
Still wondering if entrepreneurship is it for You? Check out the following infographic to find out what are the tips and tricks which includes 10 signs you might be an entrepreneur.
The 10 Best Places To Pee
The average person spends 3 years on the toilet. Seems like a long time to be spent in dull surroundings, doesn’t it? Fear not though! BetterBathrooms.com has put together this handy infographic on the 10 best places to pee and just in time for “World Toilet Day” which is today. So whether your in a bathroom ,6000 feet above ground level, or surrounded by 80,000 fresh violets, going to the loo will never be boring again.
Evolution of Nexus Devices
Google’s first Nexus phone started out as a developer device, but through the years the lineup became more and more popular with the end-user market as well. Last year’s Nexus devices produced great sales figures, and the new generation is even more promising. To celebrate the arrival of the Nexus 5, this infographic shows the evolution of Google’s Nexus phones, from the beginning to the brand new handset.
War Against the Homeless
This infographic includes exhaustive data about homelessness including states accounting for nearly half the homeless population, states having the highest rates of unsheltered homeless and more.
Partners


Browse Archives By Category
Animated Infographics
Business Infographics
Career & Jobs Infographics
Education Infographics
Entertainment Industry Infographics
Environmental Infographics
Finance & Money Infographics
Food & Drink Infographics
Health Infographics
Historical Infographics
Home & Garden Infographics
Internet Infographics
Law and Legal Infographics
Lifestyle Infographics
Marketing Infographics
Offbeat Infographics
Parenting Infographics
Pets & Animals Infographics
Political Infographics
Shopping Infographics
Sports and Athletic Infographics
Technology Infographics
Transportation Infographics
Travel Infographics
Video Infographics