


Search 12,100+ Infographics!
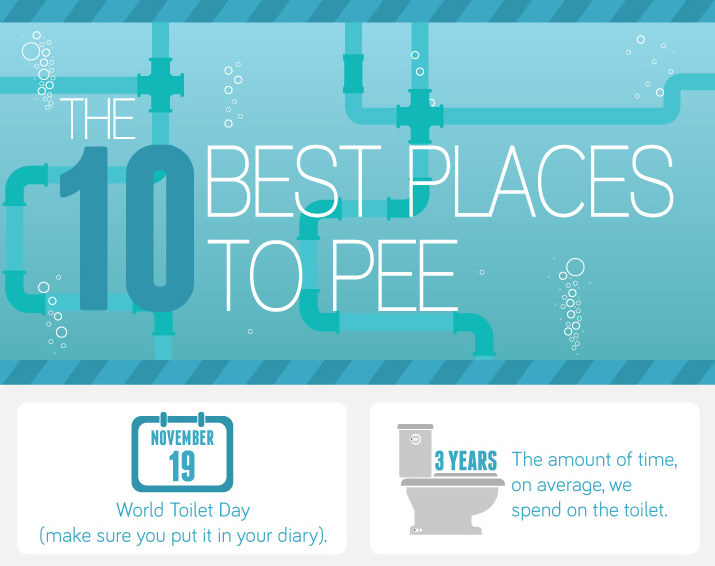
The 10 Best Places To Pee
The average person spends 3 years on the toilet. Seems like a long time to be spent in dull surroundings, doesn’t it? Fear not though! BetterBathrooms.com has put together this handy infographic on the 10 best places to pee and just in time for “World Toilet Day” which is today. So whether your in a bathroom ,6000 feet above ground level, or surrounded by 80,000 fresh violets, going to the loo will never be boring again.
Evolution of Nexus Devices
Google’s first Nexus phone started out as a developer device, but through the years the lineup became more and more popular with the end-user market as well. Last year’s Nexus devices produced great sales figures, and the new generation is even more promising. To celebrate the arrival of the Nexus 5, this infographic shows the evolution of Google’s Nexus phones, from the beginning to the brand new handset.
War Against the Homeless
This infographic includes exhaustive data about homelessness including states accounting for nearly half the homeless population, states having the highest rates of unsheltered homeless and more.
Data Mining & Decision Support: Secrets to Crafting a Powerful Marketing Strategy
The way in which marketers do research is continuing to change, thanks to organizations like Facebook and Google. Not only can marketers source data on their current customer base, but also predict future trends and outcomes related to their business. Data mining and decision support systems are at the forefront of business and marketing – are you ready to take your business to the next level?
Cyberbullying
Cyberbullying is defined as the “willful and repeated harm inflicted through the use of computers, cell phones, and other electronic devices.” With 80% of teens on cell phones and the same on social media sites, it’s time to understand that technology is connecting teens in ways they can’t escape. Best Education Degrees explores this issue in the following infographic.

One CRM to Rule Them All
The CRM world is complex; with new cutting edge features being released all the time and an unlimited supply of platforms, it can be hard to keep up. The rapid pace of the industry creates great opportunity as well as great risk. What many see as a single mission with a single goal can actually be broken down into various elements in a CRM system, all of which are important in order to succeed.
Bricks to Brains: Evolution of Cellphones
Cell phones were first invented back in 1973, with the first cell phone available to the public being the $3,995 Motorola DynaTac in 1983. Fast-forward to 2013, and there are 3.5 million cell phone users-including you! Computer Science Degree Hub has created an infographic explaining the history of the cell phone, the most popular models, and the top companies in the cell phone business.

Getting a Degree Without Breaking the Bank
There’s no two ways about it: College is expensive. From books and supplies to rent and tuition, students are struggling with more debt than ever before. An average college degree costs $88,000, and leaves a student $23,000 in debt. With $1 trillion in outstanding student loans across the nation, it’s no surprise that college enrollment is on the decline.

The US Power Sector: Big Concerns and Big Opportunity
The US Power Sector is facing a crossroads – an aging demographic and a decreasing number of graduates are shrinking the workforce dramatically. What’s next for the US Power Sector? Find out in this infographic from New Jersey Institute of Technology.
Food Stamp and SNAP Facts – Politicians are Lying
Politicians are lying to you. Food stamps are not evil. They nourish the nation. Hunger exists in American. Although it may be hard to imagine, given that we live in such a prosperous nation, there are many Americans who are suffering from hunger. According to Feeding America, one in six Americans do not have adequate access to food. This statistic includes 17 million children.
The 10 Best Places To Pee
The average person spends 3 years on the toilet. Seems like a long time to be spent in dull surroundings, doesn’t it? Fear not though! BetterBathrooms.com has put together this handy infographic on the 10 best places to pee and just in time for “World Toilet Day” which is today. So whether your in a bathroom ,6000 feet above ground level, or surrounded by 80,000 fresh violets, going to the loo will never be boring again.
Evolution of Nexus Devices
Google’s first Nexus phone started out as a developer device, but through the years the lineup became more and more popular with the end-user market as well. Last year’s Nexus devices produced great sales figures, and the new generation is even more promising. To celebrate the arrival of the Nexus 5, this infographic shows the evolution of Google’s Nexus phones, from the beginning to the brand new handset.
War Against the Homeless
This infographic includes exhaustive data about homelessness including states accounting for nearly half the homeless population, states having the highest rates of unsheltered homeless and more.
Data Mining & Decision Support: Secrets to Crafting a Powerful Marketing Strategy
The way in which marketers do research is continuing to change, thanks to organizations like Facebook and Google. Not only can marketers source data on their current customer base, but also predict future trends and outcomes related to their business. Data mining and decision support systems are at the forefront of business and marketing – are you ready to take your business to the next level?
Cyberbullying
Cyberbullying is defined as the “willful and repeated harm inflicted through the use of computers, cell phones, and other electronic devices.” With 80% of teens on cell phones and the same on social media sites, it’s time to understand that technology is connecting teens in ways they can’t escape. Best Education Degrees explores this issue in the following infographic.
One CRM to Rule Them All
The CRM world is complex; with new cutting edge features being released all the time and an unlimited supply of platforms, it can be hard to keep up. The rapid pace of the industry creates great opportunity as well as great risk. What many see as a single mission with a single goal can actually be broken down into various elements in a CRM system, all of which are important in order to succeed.
Bricks to Brains: Evolution of Cellphones
Cell phones were first invented back in 1973, with the first cell phone available to the public being the $3,995 Motorola DynaTac in 1983. Fast-forward to 2013, and there are 3.5 million cell phone users-including you! Computer Science Degree Hub has created an infographic explaining the history of the cell phone, the most popular models, and the top companies in the cell phone business.
Getting a Degree Without Breaking the Bank
There’s no two ways about it: College is expensive. From books and supplies to rent and tuition, students are struggling with more debt than ever before. An average college degree costs $88,000, and leaves a student $23,000 in debt. With $1 trillion in outstanding student loans across the nation, it’s no surprise that college enrollment is on the decline.
The US Power Sector: Big Concerns and Big Opportunity
The US Power Sector is facing a crossroads – an aging demographic and a decreasing number of graduates are shrinking the workforce dramatically. What’s next for the US Power Sector? Find out in this infographic from New Jersey Institute of Technology.
Food Stamp and SNAP Facts – Politicians are Lying
Politicians are lying to you. Food stamps are not evil. They nourish the nation. Hunger exists in American. Although it may be hard to imagine, given that we live in such a prosperous nation, there are many Americans who are suffering from hunger. According to Feeding America, one in six Americans do not have adequate access to food. This statistic includes 17 million children.
Partners


Browse Archives By Category
Animated Infographics
Business Infographics
Career & Jobs Infographics
Education Infographics
Entertainment Industry Infographics
Environmental Infographics
Finance & Money Infographics
Food & Drink Infographics
Health Infographics
Historical Infographics
Home & Garden Infographics
Internet Infographics
Law and Legal Infographics
Lifestyle Infographics
Marketing Infographics
Offbeat Infographics
Parenting Infographics
Pets & Animals Infographics
Political Infographics
Shopping Infographics
Sports and Athletic Infographics
Technology Infographics
Transportation Infographics
Travel Infographics
Video Infographics