


Search 12,100+ Infographics!
How to Increase the Domain Authority of Your Site
Domain Authority is an important metric that has a strong correlation with organic search rankings. Having a higher Domain Authority than most of your competitor sites means that your site is more likely to rank in search engines. So, to give your site’s overall SEO a boost, you definitely need to increase the Domain Authority of your site.
Eye-Opening Statistics About Men and Sex
Attention all women! Ever wonder what men are really thinking? While most women believe they’ve got men pegged down to a T (anything involving beer, buffalo wings and breasts generally spring to mind), it’s about time we delve a little bit deeper. What really goes on behind the inner workings of the male mind? Do we even want to know?
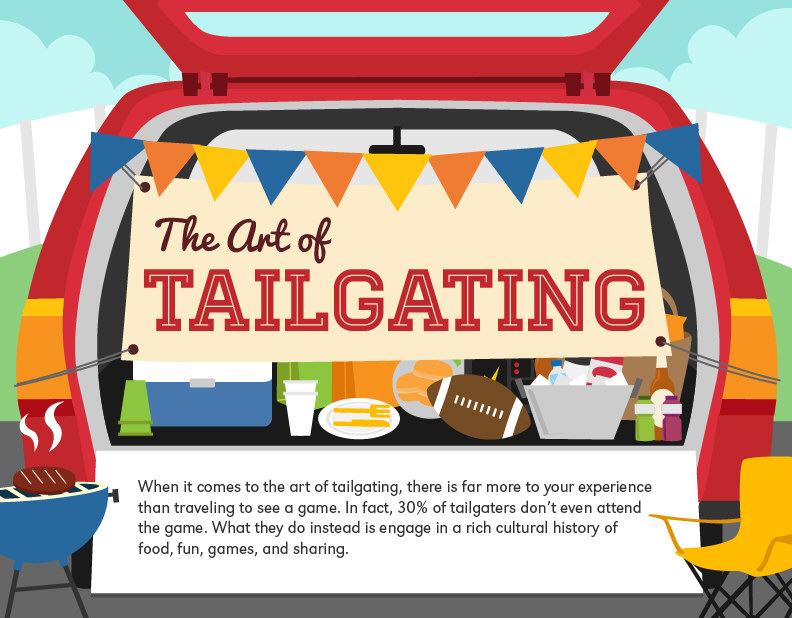
The Art of Tailgating
The following infographic presents helpful information that can help you plan for your next unforgettable tailgating party. It outlines common tailgating trends in relation to food, location, and game preferences, associated costs, supplies used, and additional methods for success.
Opsview Management of Network Technologies and Standards
Completed in Q3 of 2013, this survey explored management of network technologies and standards. Over 250 respondents from around the world provided insight into core network functionality including SNMP, *flow technology, syslog management and preferred hardware vendors. The results are presented visually in the following infographic from Opsview.
What’s A Traffic Jam Worth?
The following infographic goes in detail about how much traffic congestion and daily commutes cost businesses. The results may surprise you!
How Do You Sleep?
We all sleep. Most enjoy it, but not everyone gets the recommended daily amount. This can be due to a variety of factors, some of which are out of our control. The foetal sleeping position is the most common, but do you or your partner sleep in another position? Have you ever had a proper think about the way you sleep? You may just amaze yourself at your sleeping habits.

Woodworkers 101
Over the 45,000 years that people have been woodworking, wood has protected us, sheltered us – it’s carried water from the well, stored our precious cargo, framed pictures of our dogs and cradled our babes. Wood allows us to sit at the table for dinner and it complements our personal flare.

The Author Rank Building Machine
In the future, Author Rank may be a new metric that we see from Google in ranking web pages / content and the author who created it.To be prepared for such an update, it’s time to fire up the machine and start applying the attributes of Author Rank. The following animated infographic provides you everything you need to know regarding Google authorship and Author Rank.
25 Incredible Facts About Hong Kong Venues & Events
Hong Kong, one of the world’s most vibrant and exciting cities, hosts some truly world-class events in its calendar, a fact sometimes lost on those who view the SAR as merely a finance hub. It’s also home to some of Asia’s most spectacular event venues. This infographic is simply a celebration of the most remarkable of these.

The SSD Application Process: Know Your Rights!
According to The Social Security Administration, an estimated 58 million Americans will receive $816 billion Social Security benefits in 2013. Will you be one of them? While great emphasis is placed on financial planning to secure adequate funds for retirement, not nearly enough attention is paid to the possible onset of future disability.
How to Increase the Domain Authority of Your Site
Domain Authority is an important metric that has a strong correlation with organic search rankings. Having a higher Domain Authority than most of your competitor sites means that your site is more likely to rank in search engines. So, to give your site’s overall SEO a boost, you definitely need to increase the Domain Authority of your site.
Eye-Opening Statistics About Men and Sex
Attention all women! Ever wonder what men are really thinking? While most women believe they’ve got men pegged down to a T (anything involving beer, buffalo wings and breasts generally spring to mind), it’s about time we delve a little bit deeper. What really goes on behind the inner workings of the male mind? Do we even want to know?
The Art of Tailgating
The following infographic presents helpful information that can help you plan for your next unforgettable tailgating party. It outlines common tailgating trends in relation to food, location, and game preferences, associated costs, supplies used, and additional methods for success.
Opsview Management of Network Technologies and Standards
Completed in Q3 of 2013, this survey explored management of network technologies and standards. Over 250 respondents from around the world provided insight into core network functionality including SNMP, *flow technology, syslog management and preferred hardware vendors. The results are presented visually in the following infographic from Opsview.
What’s A Traffic Jam Worth?
The following infographic goes in detail about how much traffic congestion and daily commutes cost businesses. The results may surprise you!
How Do You Sleep?
We all sleep. Most enjoy it, but not everyone gets the recommended daily amount. This can be due to a variety of factors, some of which are out of our control. The foetal sleeping position is the most common, but do you or your partner sleep in another position? Have you ever had a proper think about the way you sleep? You may just amaze yourself at your sleeping habits.
Woodworkers 101
Over the 45,000 years that people have been woodworking, wood has protected us, sheltered us – it’s carried water from the well, stored our precious cargo, framed pictures of our dogs and cradled our babes. Wood allows us to sit at the table for dinner and it complements our personal flare.
The Author Rank Building Machine
In the future, Author Rank may be a new metric that we see from Google in ranking web pages / content and the author who created it.To be prepared for such an update, it’s time to fire up the machine and start applying the attributes of Author Rank. The following animated infographic provides you everything you need to know regarding Google authorship and Author Rank.
25 Incredible Facts About Hong Kong Venues & Events
Hong Kong, one of the world’s most vibrant and exciting cities, hosts some truly world-class events in its calendar, a fact sometimes lost on those who view the SAR as merely a finance hub. It’s also home to some of Asia’s most spectacular event venues. This infographic is simply a celebration of the most remarkable of these.
The SSD Application Process: Know Your Rights!
According to The Social Security Administration, an estimated 58 million Americans will receive $816 billion Social Security benefits in 2013. Will you be one of them? While great emphasis is placed on financial planning to secure adequate funds for retirement, not nearly enough attention is paid to the possible onset of future disability.
Partners


Browse Archives By Category
Animated Infographics
Business Infographics
Career & Jobs Infographics
Education Infographics
Entertainment Industry Infographics
Environmental Infographics
Finance & Money Infographics
Food & Drink Infographics
Health Infographics
Historical Infographics
Home & Garden Infographics
Internet Infographics
Law and Legal Infographics
Lifestyle Infographics
Marketing Infographics
Offbeat Infographics
Parenting Infographics
Pets & Animals Infographics
Political Infographics
Shopping Infographics
Sports and Athletic Infographics
Technology Infographics
Transportation Infographics
Travel Infographics
Video Infographics