


Search 12,100+ Infographics!
Drugs and the Genetic Code
It’s true that the apple doesn’t fall far from the tree. This is mostly due to genetics. What your parents pass down to you in your genetic code can define your personality, hobbies and appearance. Some common traits that are genetic include blood type, height, smell and obesity. This infographic takes a look what role genetics play in drug use and addiction.
10 Science-Based Reasons To Start Meditating Today
This infographic from Emma Seppala, Ph.D. portrays the scientific benefits of meditation. It summarizes all of the latest research on meditation for health, well-being and the brain.
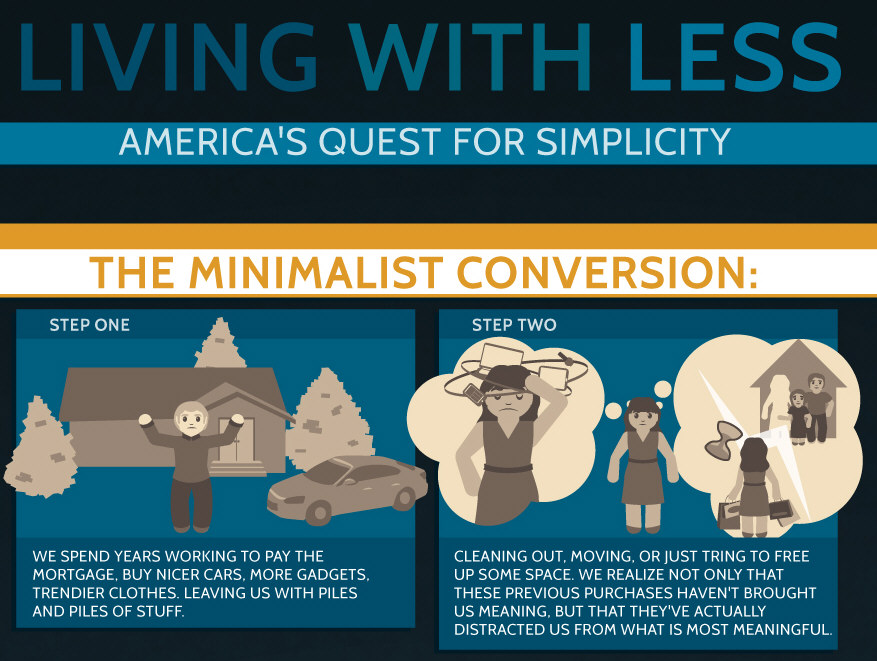
Living with Less: America’s Quest for Simplicity
How has the American way of living changed? This infographic will give you a good idea. From living pace to free time Americans have adjusted to a life that is often debated as stressful and burdensome.

The Law School Bubble Has Burst
In the following infographic, you can see the fluctuation of new law school students compared to graduates who have found work in the law field. For example, in 2010 nearly 50,000 students accepted admission to law schools. From the same year, only 51% of graduates found employment in private practice.

Direct Carrier Billing: The Most Popular Mobile Payment
This infographic illustrates how carrier billing is used now and explores how it might be applied in the future, giving consumers boarding a bus or rooting for their local team the ability to say, “Put it on my bill.”
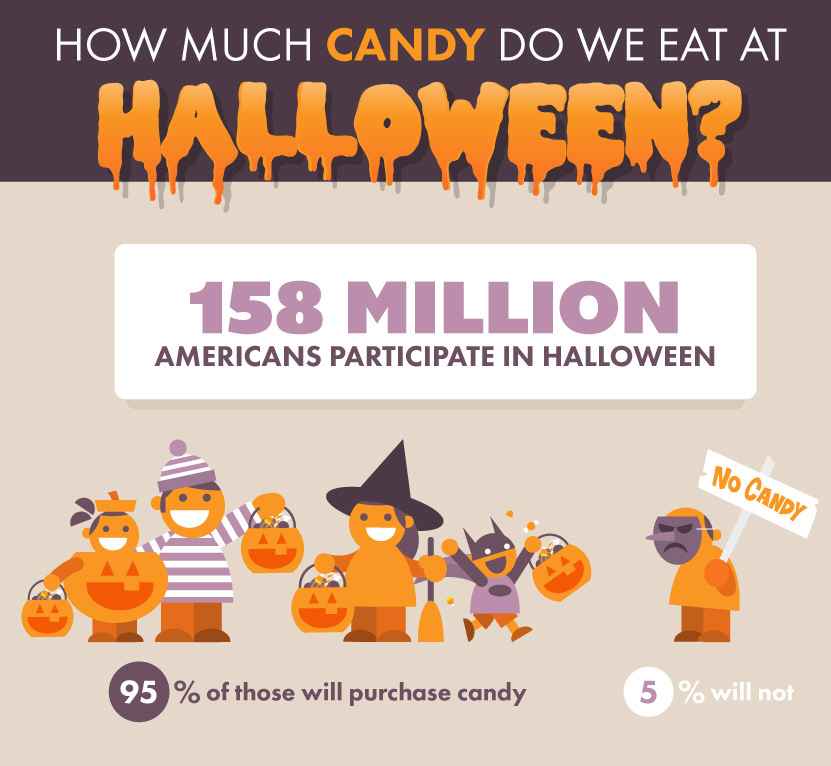
How Much Candy Do We Eat at Halloween?
Just how much candy do we eat at Halloween? Well, certainly a lot. Americans eat the weight of six Titanic ships in candy every October 31! Kids eat 13 Big Mac’s worth of calories in one night! See the following infographic for more mind-boggling facts and figures about America’s spookiest holiday.
How To Host a Downton Abbey Dinner Party
With the fourth season of “Downton Abbey” now premiering, why not throw a glamorous dinner party inspired by the old tradition? Terrys Fabrics shows us how in the following infographic.
Movies That Made Vehicular Legends
Movies have an undeniably massive impact on culture and industries. One of the major industries movies have (and continue) to influence is the automotive industry. From Bullitt’s cult-classic 1968 Ford Mustang GT 390 Fastback to the mythical Batmobile, here are six automotive marvels.
How To Create an Art Deco Inspired Home
If you’re looking for classic style from a bygone age, the glamorous Art Deco era of the 1920s and 1930s works brilliantly in interior design. With its bold geometric shapes and strong colors, you can tailor your style to be as modern or retro as you like. Take a look at this infographic for inspiration and ideas, to help inject some razzmatazz into your home.
Evolving Technology in Musical Education
Music education is an important, but often overlooked, form of education that has countless benefits. Music education is evolving rapidly and there are now many cost effective and beneficial tools to help make music education possible, like the iPad. To learn more about how music education is evolving in the education world, checkout this infographic.
Drugs and the Genetic Code
It’s true that the apple doesn’t fall far from the tree. This is mostly due to genetics. What your parents pass down to you in your genetic code can define your personality, hobbies and appearance. Some common traits that are genetic include blood type, height, smell and obesity. This infographic takes a look what role genetics play in drug use and addiction.
10 Science-Based Reasons To Start Meditating Today
This infographic from Emma Seppala, Ph.D. portrays the scientific benefits of meditation. It summarizes all of the latest research on meditation for health, well-being and the brain.
Living with Less: America’s Quest for Simplicity
How has the American way of living changed? This infographic will give you a good idea. From living pace to free time Americans have adjusted to a life that is often debated as stressful and burdensome.
The Law School Bubble Has Burst
In the following infographic, you can see the fluctuation of new law school students compared to graduates who have found work in the law field. For example, in 2010 nearly 50,000 students accepted admission to law schools. From the same year, only 51% of graduates found employment in private practice.
Direct Carrier Billing: The Most Popular Mobile Payment
This infographic illustrates how carrier billing is used now and explores how it might be applied in the future, giving consumers boarding a bus or rooting for their local team the ability to say, “Put it on my bill.”
How Much Candy Do We Eat at Halloween?
Just how much candy do we eat at Halloween? Well, certainly a lot. Americans eat the weight of six Titanic ships in candy every October 31! Kids eat 13 Big Mac’s worth of calories in one night! See the following infographic for more mind-boggling facts and figures about America’s spookiest holiday.
How To Host a Downton Abbey Dinner Party
With the fourth season of “Downton Abbey” now premiering, why not throw a glamorous dinner party inspired by the old tradition? Terrys Fabrics shows us how in the following infographic.
Movies That Made Vehicular Legends
Movies have an undeniably massive impact on culture and industries. One of the major industries movies have (and continue) to influence is the automotive industry. From Bullitt’s cult-classic 1968 Ford Mustang GT 390 Fastback to the mythical Batmobile, here are six automotive marvels.
How To Create an Art Deco Inspired Home
If you’re looking for classic style from a bygone age, the glamorous Art Deco era of the 1920s and 1930s works brilliantly in interior design. With its bold geometric shapes and strong colors, you can tailor your style to be as modern or retro as you like. Take a look at this infographic for inspiration and ideas, to help inject some razzmatazz into your home.
Evolving Technology in Musical Education
Music education is an important, but often overlooked, form of education that has countless benefits. Music education is evolving rapidly and there are now many cost effective and beneficial tools to help make music education possible, like the iPad. To learn more about how music education is evolving in the education world, checkout this infographic.
Partners


Browse Archives By Category
Animated Infographics
Business Infographics
Career & Jobs Infographics
Education Infographics
Entertainment Industry Infographics
Environmental Infographics
Finance & Money Infographics
Food & Drink Infographics
Health Infographics
Historical Infographics
Home & Garden Infographics
Internet Infographics
Law and Legal Infographics
Lifestyle Infographics
Marketing Infographics
Offbeat Infographics
Parenting Infographics
Pets & Animals Infographics
Political Infographics
Shopping Infographics
Sports and Athletic Infographics
Technology Infographics
Transportation Infographics
Travel Infographics
Video Infographics