


Search 12,100+ Infographics!

The 10 Types of Office Sitter
Have you ever noticed within your place of work that people tend to sit in all manner of positions? Some might say we adopt such positions based on our personality. The folks at ChairOffice have decided to put a humorous spin on this and present to you, “The 10 Types of Office Sitter.” Can you relate to any of the sitting positions below?
How to Repair a Phone Dropped in the Toilet
Dropping your phone down the toilet is just as heartbreaking as losing it, but the bonus with getting it wet (if it is a bonus)is that there is a potential fix for this problem. The folks at Plumbworld have laid it all out in the form of a handy infographic.
9 Things You Cannot Do Without In A Serviced Apartment
This infographic examines the most common facilities one gets in serviced apartments which gives you the best accommodation experience, comparable to the luxury of five star hotels and the comfort of your own apartments.
Evolution of the Luxury Watch
Did you know the watch is one of the world’s oldest inventions? And we have come a long way since the beginning of its history. The following infographic from takes a look at the evolution of the luxury watch.
Things to Think About When Advertising Internationally
When advertising internationally you want to make sure your brand stays consistent. Check out the infographic below to learn about things to think about when advertising overseas.

Surprising Truths About The Gender Pay Gap
Men continue to earn more than women, but contrary to popular belief, sex discrimination alone is not to blame. It’s much more than that — the pay males make in comparison to what females earn is determined by a lot of different factors, such as experience, education, and even location. The following infographic takes a look at this issue in more detail.
11 Fastest Players in NFL History
Can you guess which are the fastest players in NFL history? Sure we’ve had some great players, but which have been the fastest? In this infographic, reminiscence on the past and find out which players run faster, what positions they played, what teams they played for during their career and what other accomplishments they had during their career.
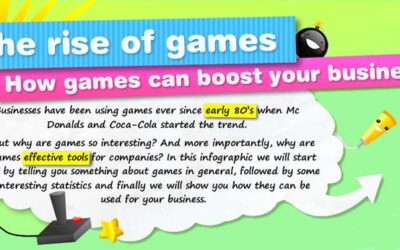
The Rise of Games
Businesses have been using games ever since early 80’s when McDonalds and Coca-Cola started the trend. But why are games so interesting? And more importantly, why are games effective tools for companies?
London
The fair city of London is a vast place, full of wonderful people + places. To celebrate London, Printsome has put together this infographic that includes several facts about the city.
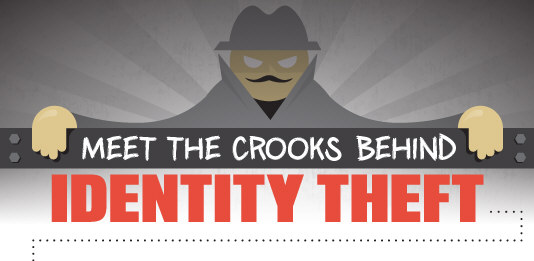
Meet the Crooks Behind Identity Theft
Identity theft is growing 15-20% a year and every one of us is a potential victim, regardless of our age, nationality, or status. Victims of identity theft suffer more than just financial loss. Damage to their reputation and credit rating could take months and sometimes years to repair! The following infographic introduces you to the 3 crooks behind identity theft.
The 10 Types of Office Sitter
Have you ever noticed within your place of work that people tend to sit in all manner of positions? Some might say we adopt such positions based on our personality. The folks at ChairOffice have decided to put a humorous spin on this and present to you, “The 10 Types of Office Sitter.” Can you relate to any of the sitting positions below?
How to Repair a Phone Dropped in the Toilet
Dropping your phone down the toilet is just as heartbreaking as losing it, but the bonus with getting it wet (if it is a bonus)is that there is a potential fix for this problem. The folks at Plumbworld have laid it all out in the form of a handy infographic.
9 Things You Cannot Do Without In A Serviced Apartment
This infographic examines the most common facilities one gets in serviced apartments which gives you the best accommodation experience, comparable to the luxury of five star hotels and the comfort of your own apartments.
Evolution of the Luxury Watch
Did you know the watch is one of the world’s oldest inventions? And we have come a long way since the beginning of its history. The following infographic from takes a look at the evolution of the luxury watch.
Things to Think About When Advertising Internationally
When advertising internationally you want to make sure your brand stays consistent. Check out the infographic below to learn about things to think about when advertising overseas.
Surprising Truths About The Gender Pay Gap
Men continue to earn more than women, but contrary to popular belief, sex discrimination alone is not to blame. It’s much more than that — the pay males make in comparison to what females earn is determined by a lot of different factors, such as experience, education, and even location. The following infographic takes a look at this issue in more detail.
11 Fastest Players in NFL History
Can you guess which are the fastest players in NFL history? Sure we’ve had some great players, but which have been the fastest? In this infographic, reminiscence on the past and find out which players run faster, what positions they played, what teams they played for during their career and what other accomplishments they had during their career.
The Rise of Games
Businesses have been using games ever since early 80’s when McDonalds and Coca-Cola started the trend. But why are games so interesting? And more importantly, why are games effective tools for companies?
London
The fair city of London is a vast place, full of wonderful people + places. To celebrate London, Printsome has put together this infographic that includes several facts about the city.
Meet the Crooks Behind Identity Theft
Identity theft is growing 15-20% a year and every one of us is a potential victim, regardless of our age, nationality, or status. Victims of identity theft suffer more than just financial loss. Damage to their reputation and credit rating could take months and sometimes years to repair! The following infographic introduces you to the 3 crooks behind identity theft.
Partners


Browse Archives By Category
Animated Infographics
Business Infographics
Career & Jobs Infographics
Education Infographics
Entertainment Industry Infographics
Environmental Infographics
Finance & Money Infographics
Food & Drink Infographics
Health Infographics
Historical Infographics
Home & Garden Infographics
Internet Infographics
Law and Legal Infographics
Lifestyle Infographics
Marketing Infographics
Offbeat Infographics
Parenting Infographics
Pets & Animals Infographics
Political Infographics
Shopping Infographics
Sports and Athletic Infographics
Technology Infographics
Transportation Infographics
Travel Infographics
Video Infographics